If your data pipeline were a restaurant kitchen, data profiling would be the first “taste and smell” check before anything goes on the plate. It tells you what’s in the raw ingredients, what looks off, and what will ruin dinner if you ignore it.
What data profiling is (and what it is not)
Think of data profiling as a health check for datasets. You scan data to understand its structure, content, and relationships, then measure how well it matches the rules your work depends on. The goal is not to produce insights yet. The goal is to make sure the data is understood and trustworthy before you depend on it for reporting, migration, or machine learning.
In practice, profiling produces things like:
- Column summaries (types, formats, min/max, distinct values, null rates)
- Frequency distributions (what shows up most often, what never shows up)
- Outlier flags (values far outside what looks typical)
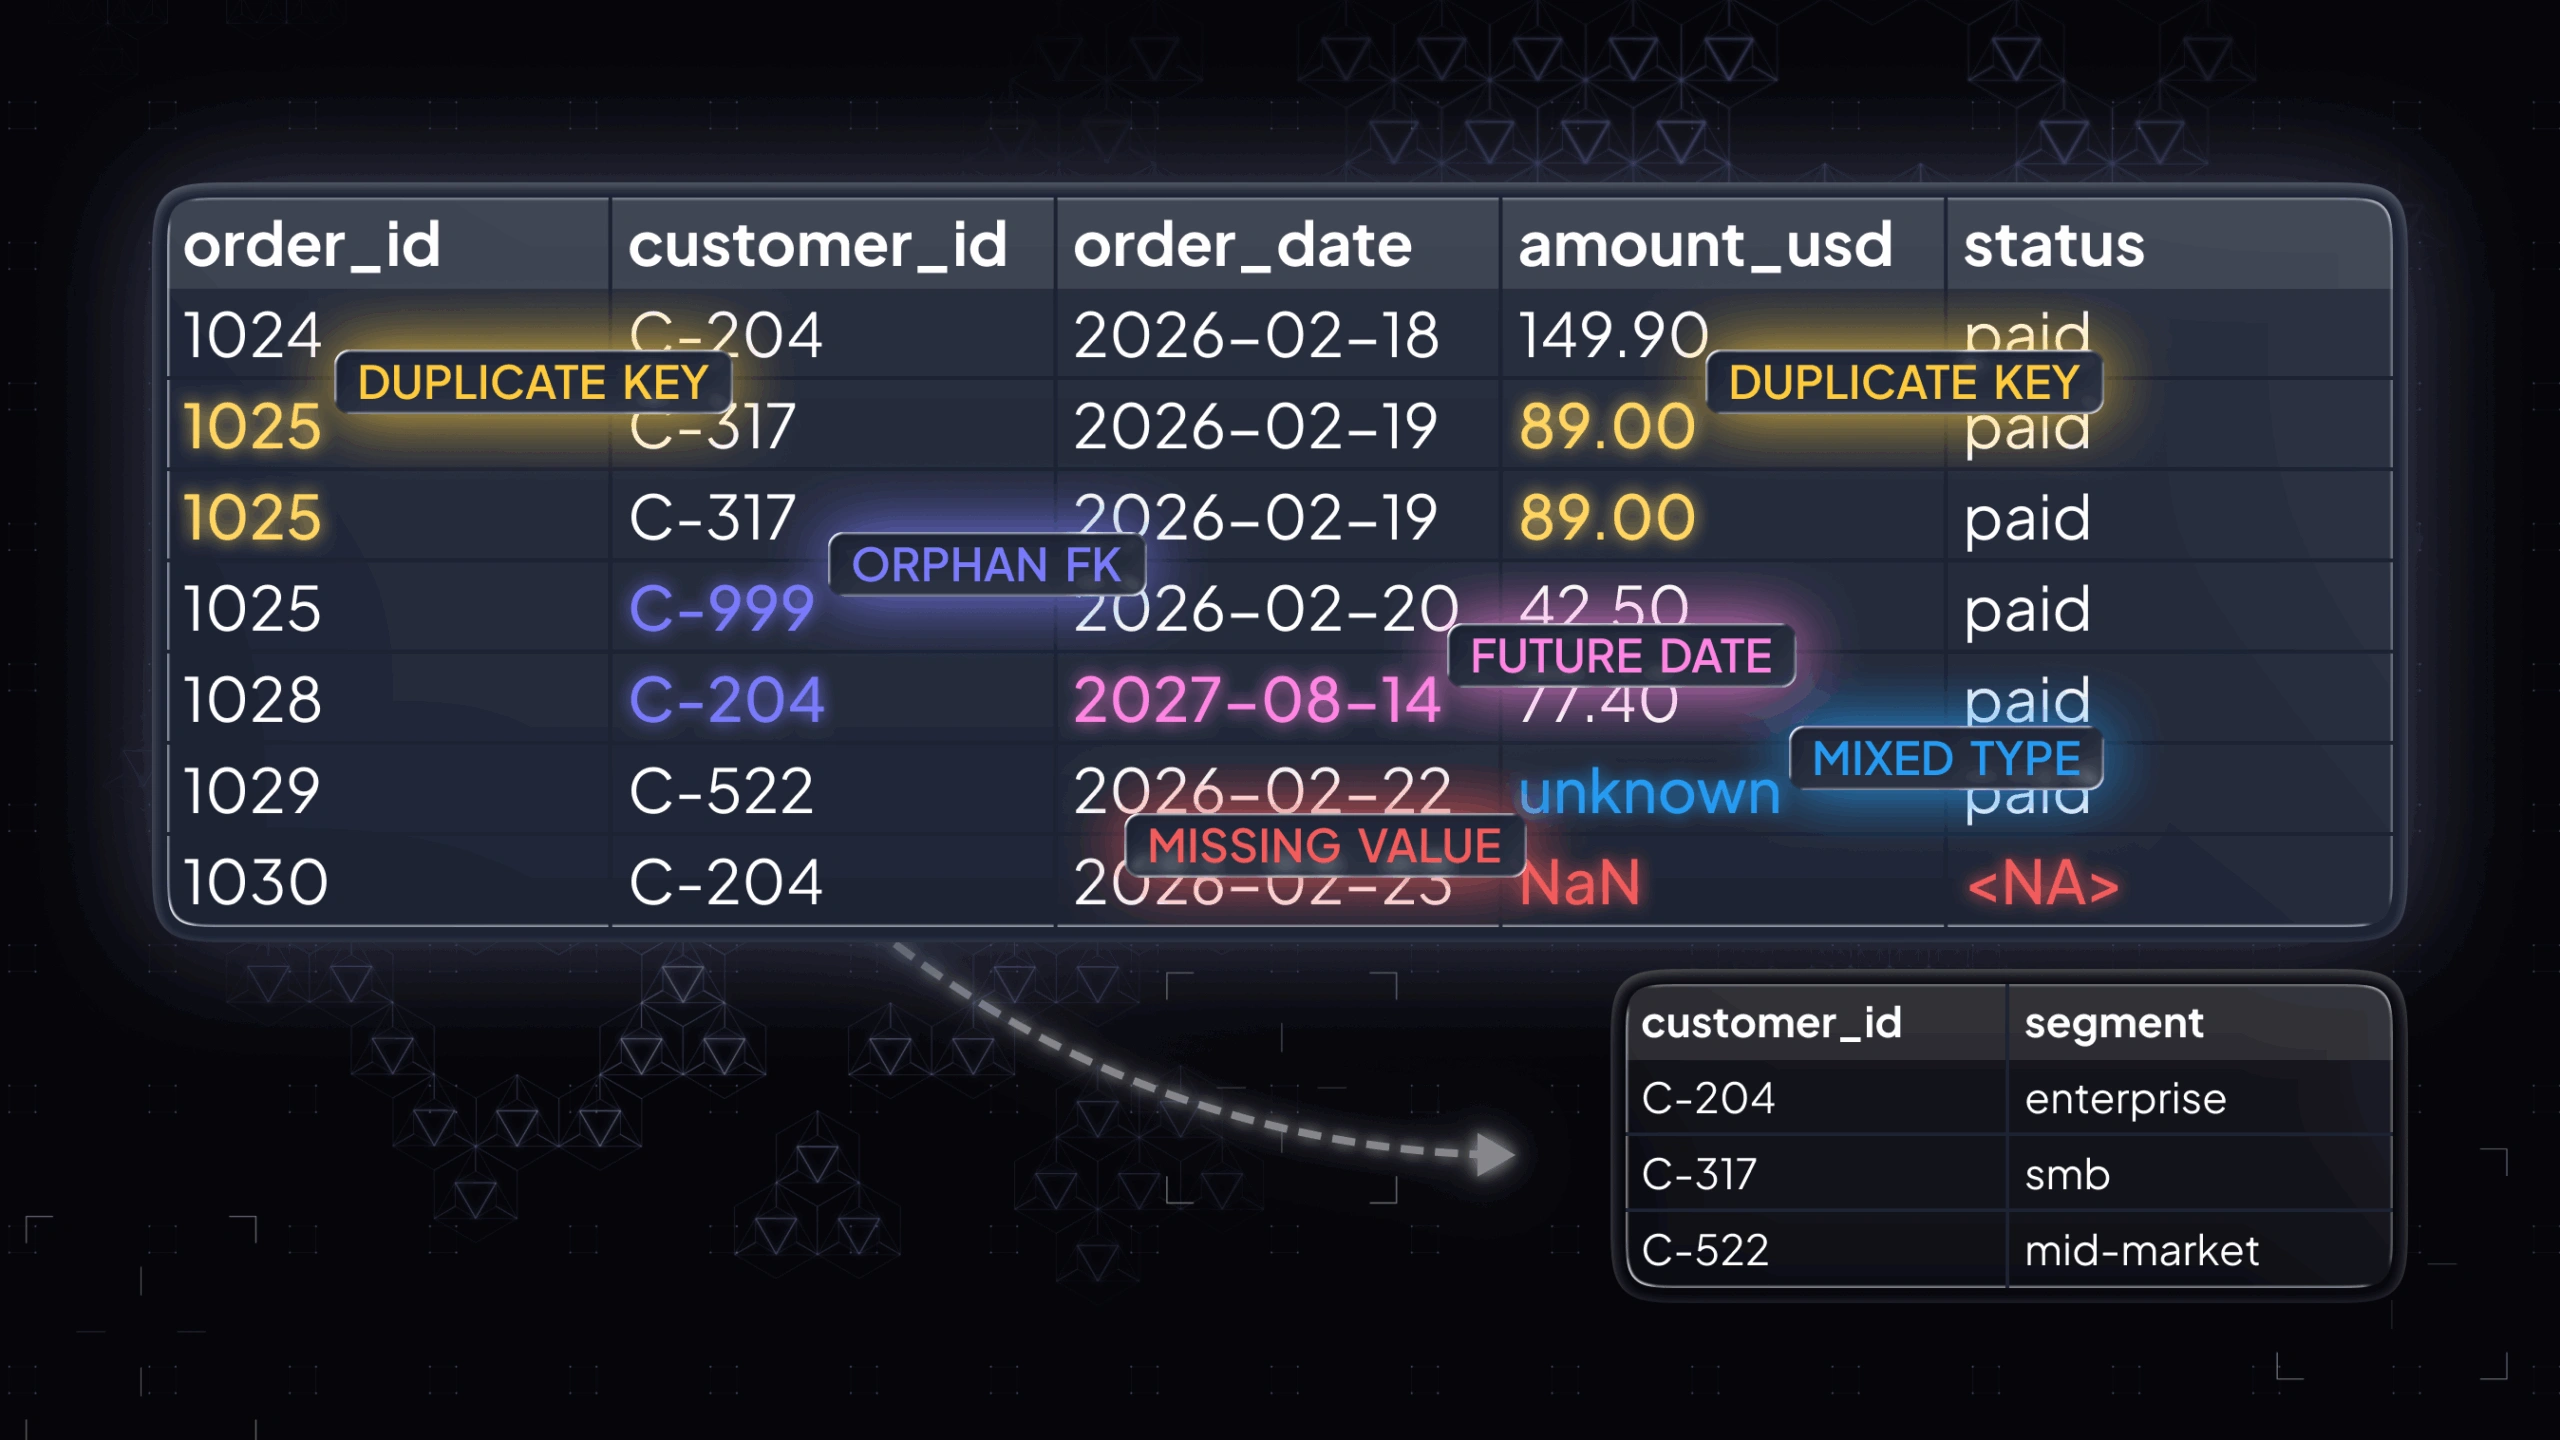
- Key and relationship checks (duplicates in “unique” fields, orphan foreign keys)
A quick example: you profile a BirthDate column and discover a chunk of values are in the future. Or you profile two tables and find a set of IDs that do not match, which means joins will silently drop rows later. Profiling surfaces these problems early, when fixes are still cheap.
Data profiling vs. data mining
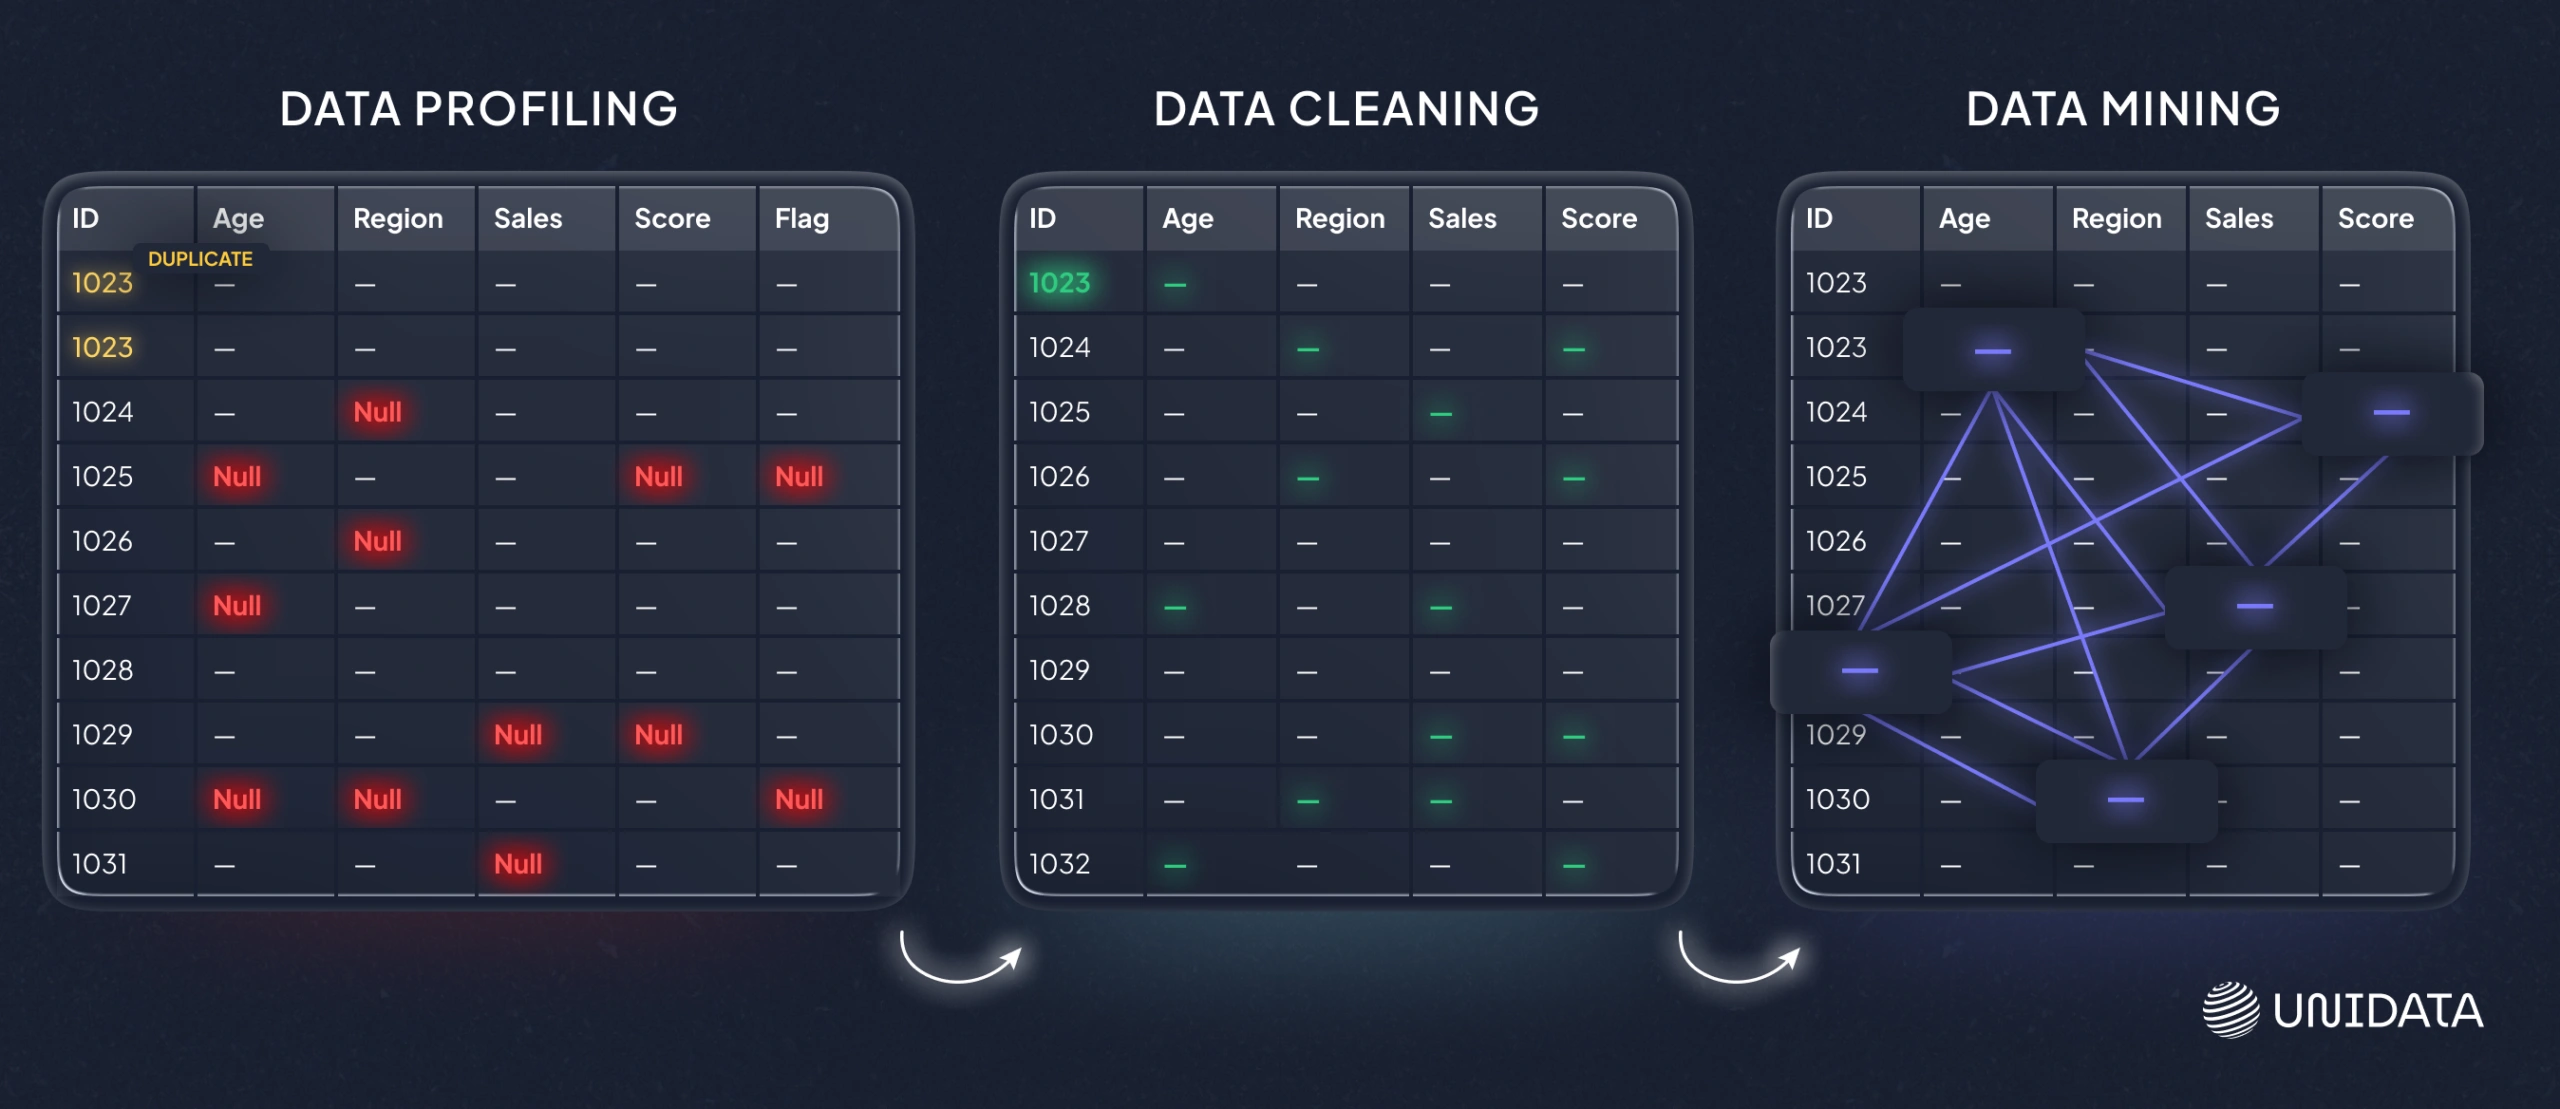
If profiling is inventorying the pantry, data mining is cooking something new from it. Data mining aims to discover patterns, correlations, and predictive signals. Data profiling aims to describe what the data already is: its distributions, formats, completeness, and linkage points.
Data profiling vs. data cleaning
Profiling is diagnosis. Cleaning is treatment. Profiling tells you “this column has five competing spellings for the same state” or “this primary key is not unique.” Cleaning decides what to do: standardize, deduplicate, impute, drop, or escalate upstream to fix the source system.
Why data profiling matters in real work
Skipping profiling is like building a house on a foundation you never inspected. It might hold. It might also crack in production, when you are least able to pause and fix it.
Data profiling matters because it reduces the two things that kill data projects:
- Hidden quality issues that distort metrics and model behavior.
- Unknown structure that causes fragile pipelines and brittle joins.
Here’s where profiling earns its keep.
Here’s where profiling earns its keep.
Validity and conformance
Validity checks answer a simple question: do values follow the rules your systems assume? This is where profiling catches fields that look fine at a glance but fail the moment you try to filter, join, parse, or validate them downstream.
- Emails that do not resemble emails. These often slip in as typos, placeholders, or copied text. They won’t match expected patterns and can break validation rules or contact workflows.
- Dates that are not real calendar dates. You might see impossible dates or mixed formats that parse inconsistently. Even when a pipeline “loads,” analytics by time period can become unreliable.
- Codes that violate allowed lists. If a field is meant to use a controlled set of values, out-of-list entries create silent category drift and fragmented reporting.
- Strings in numeric fields, or mixed types inside one column. This usually surfaces when one system exports a number as text, or when placeholders appear inside numeric fields. It can break casting, aggregations, and model feature generation.
These issues don’t just look messy. They directly cause failed loads, wrong filters, and joins that drop rows.
Accuracy signals
Profiling can’t prove a value matches reality without an external reference, but it can flag patterns that are very likely wrong. Treat this as a “sanity scan”: you are not making business decisions yet, you are identifying values that deserve review.
- Ages that exceed plausible human limits. This often points to swapped units, parsing errors, or default values that were never replaced.
- Negative values where they should never appear. This is common in revenue, inventory, duration, or count fields when a sign flips in transformation or a missing value is encoded as a negative number.
- Default placeholders that show up as real values. These are especially dangerous because they look consistent. They can inflate a category, distort averages, or create false segments.
A useful mindset here is: the goal isn’t to “remove all anomalies,” but to separate rare-but-real from broken-by-process before the data is used.
Uniqueness and duplicates
Duplicates are a classic quiet failure mode. A dataset can load successfully and still be unusable because, joins multiply rows, or models learn repeated examples as if they were independent signals.
Profiling checks whether fields that are supposed to be unique actually are. It also surfaces near-duplicates that represent the same real-world entity in multiple forms, which is common when data comes from multiple sources or when identifiers aren’t stable.
The key caveat: a “duplicate” in the data is not always an error. Sometimes it represents legitimate repeat events. Profiling helps you detect the pattern so you can decide whether uniqueness should apply at the row level, the entity level, or a composite key level.
Consistency across fields and sources
Consistency checks focus on one problem: the same concept being encoded in different ways. That inconsistency is expensive because it forces every downstream consumer to reinvent mapping logic.
- “USA” vs “United States” vs “U.S.” These represent one country but fragment counts and group-bys into multiple buckets.
- Mixed date formats across tables. Even if each table is “internally consistent,” cross-table pipelines can fail when they expect one shared standard.
- One system storing “status” as integers, another as strings. This can break joins, merges, and filtering logic, or force brittle type coercion.
Profiling makes these differences visible early so you can standardize before integration, instead of debugging inconsistencies after stakeholders see mismatched numbers.
Distribution shifts and outliers
Profiling also looks at how values are distributed, not only whether they are valid. Frequency tables and summary stats help you spot changes that can be harmless, important, or outright wrong depending on context.
- Categories that dominate unexpectedly. This can signal a pipeline defaulting into one bucket, or a real operational shift that should be tracked.
- Rare values that might be errors (or important edge cases). Rare values are where both bugs and meaningful anomalies tend to hide.
- Numeric outliers that will distort averages or scaling. Outliers can be genuine extremes, but they can also come from unit mistakes, truncation, or malformed inputs.
Outliers are not automatically wrong. Profiling is about making them visible so you can decide whether to investigate, transform, or explicitly handle them in analysis and ML.
Referential integrity and relationship breakage
When tables relate through keys, profiling checks whether those links actually hold. This is where you catch join problems before they quietly corrupt metrics or features.
- Orphan records (foreign keys that do not match any primary key). These rows will be dropped or mis-joined, depending on how you combine tables.
- Duplicated keys where you expected one-to-one. This often causes row multiplication and inflated aggregates after joins.
- Cardinalities that do not match your mental model. If you expect one-to-many and get many-to-many, downstream logic changes completely.
This is the difference between a join you can trust and a join that silently loses or duplicates data.
How data profiling works in practice
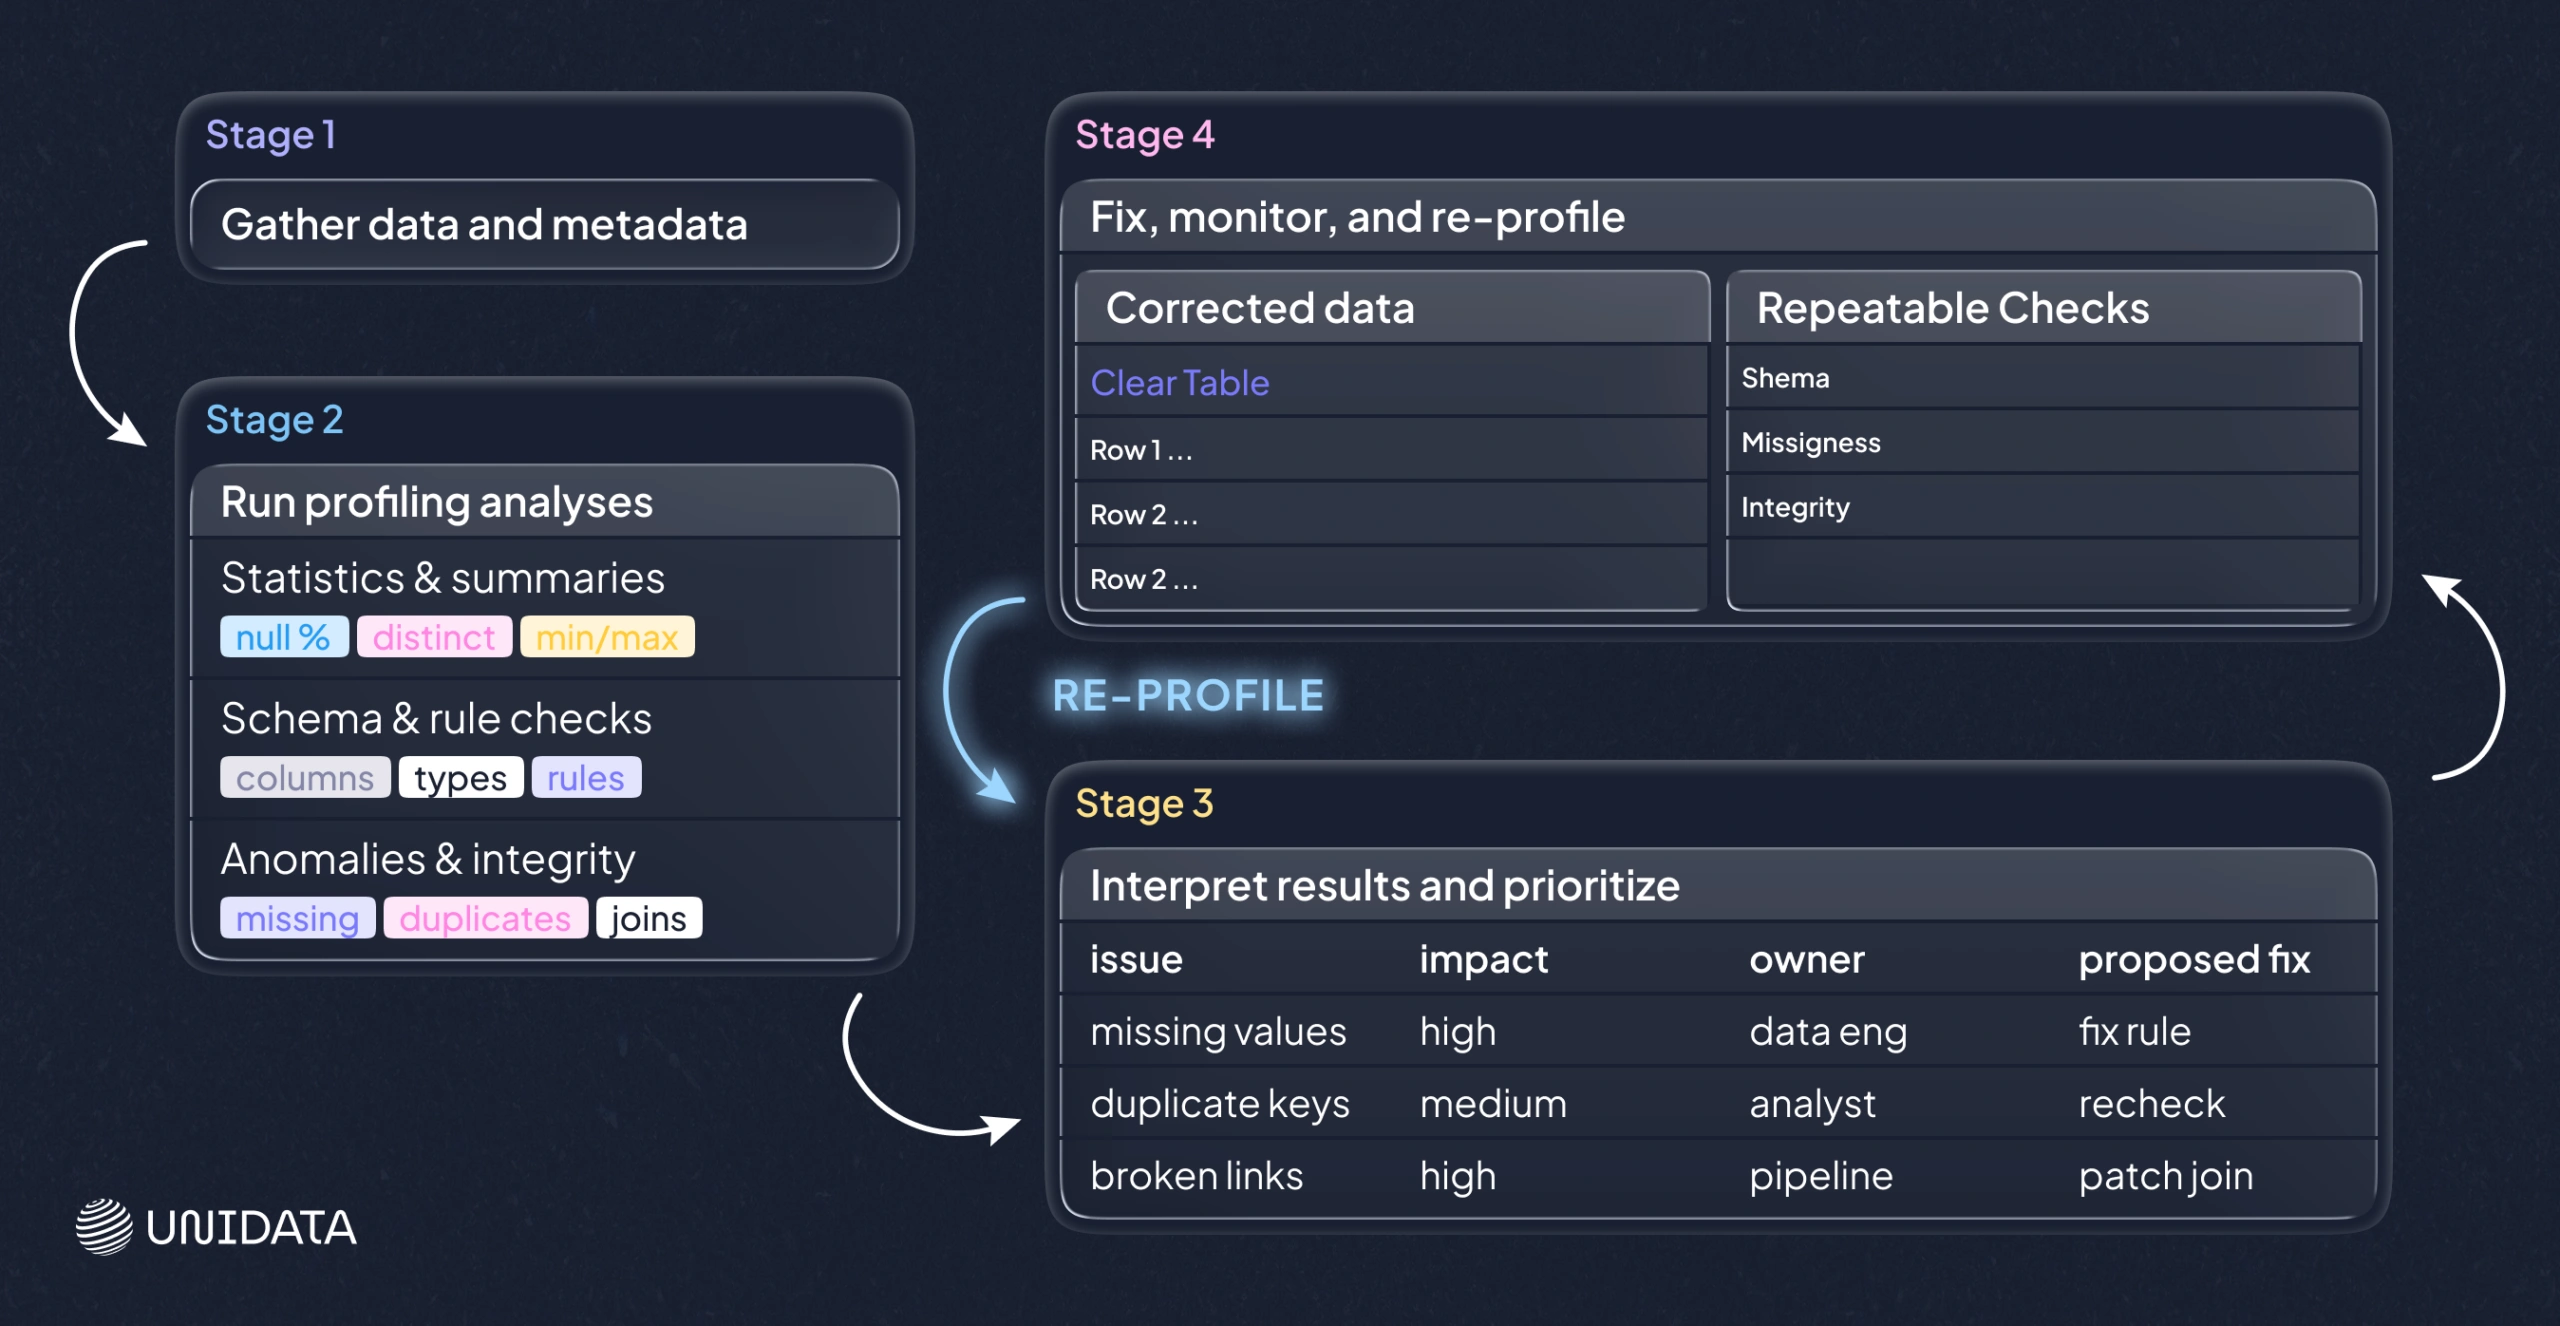
Tools can automate the scanning, but the workflow is stable across stacks: you define what you’re looking at, run a set of checks, interpret the results, and turn findings into fixes and repeatable safeguards.
1. Gather data and metadata
Start with the closest-to-source view you can access. Bring any metadata that exists, because profiling is stronger when it can compare “what’s there” to “what should be there.”
- Schemas and data types
- Constraints and allowable values
- Known keys and business definitions
Even this step can surface surprises, like a date stored as free text, or two systems using different field lengths for the same identifier.
2. Run profiling analyses
Most tooling runs a standard set of techniques. It helps to know what each one is for, because each maps to a different risk.
Column profiling (univariate)
Column profiling summarizes each field on its own. It is the fastest way to find basic issues and to understand the dataset’s shape.
- Null counts and percentages, to see missingness and placeholders
- Distinct counts and top values, to detect fragmentation and category drift
- Min/max/mean for numeric fields, to catch implausible ranges
- Common patterns for strings, to reveal format inconsistencies
Use this first when onboarding a dataset or when basic parsing/typing issues are suspected.
Cross-column profiling (within a table)
This checks whether fields behave consistently together, which is closer to real business logic than “per-column stats.”
- Conditional rules (if Status = Closed, then ClosedDate should exist)
- Dependencies (ZIP code should align with state, if those rules exist for your context)
- Composite uniqueness (no single key is unique, but a combination might be)
A key caveat: these checks can flag legitimate exceptions. The value is in surfacing the pattern, then deciding whether it should become a rule or remain an allowed edge case.
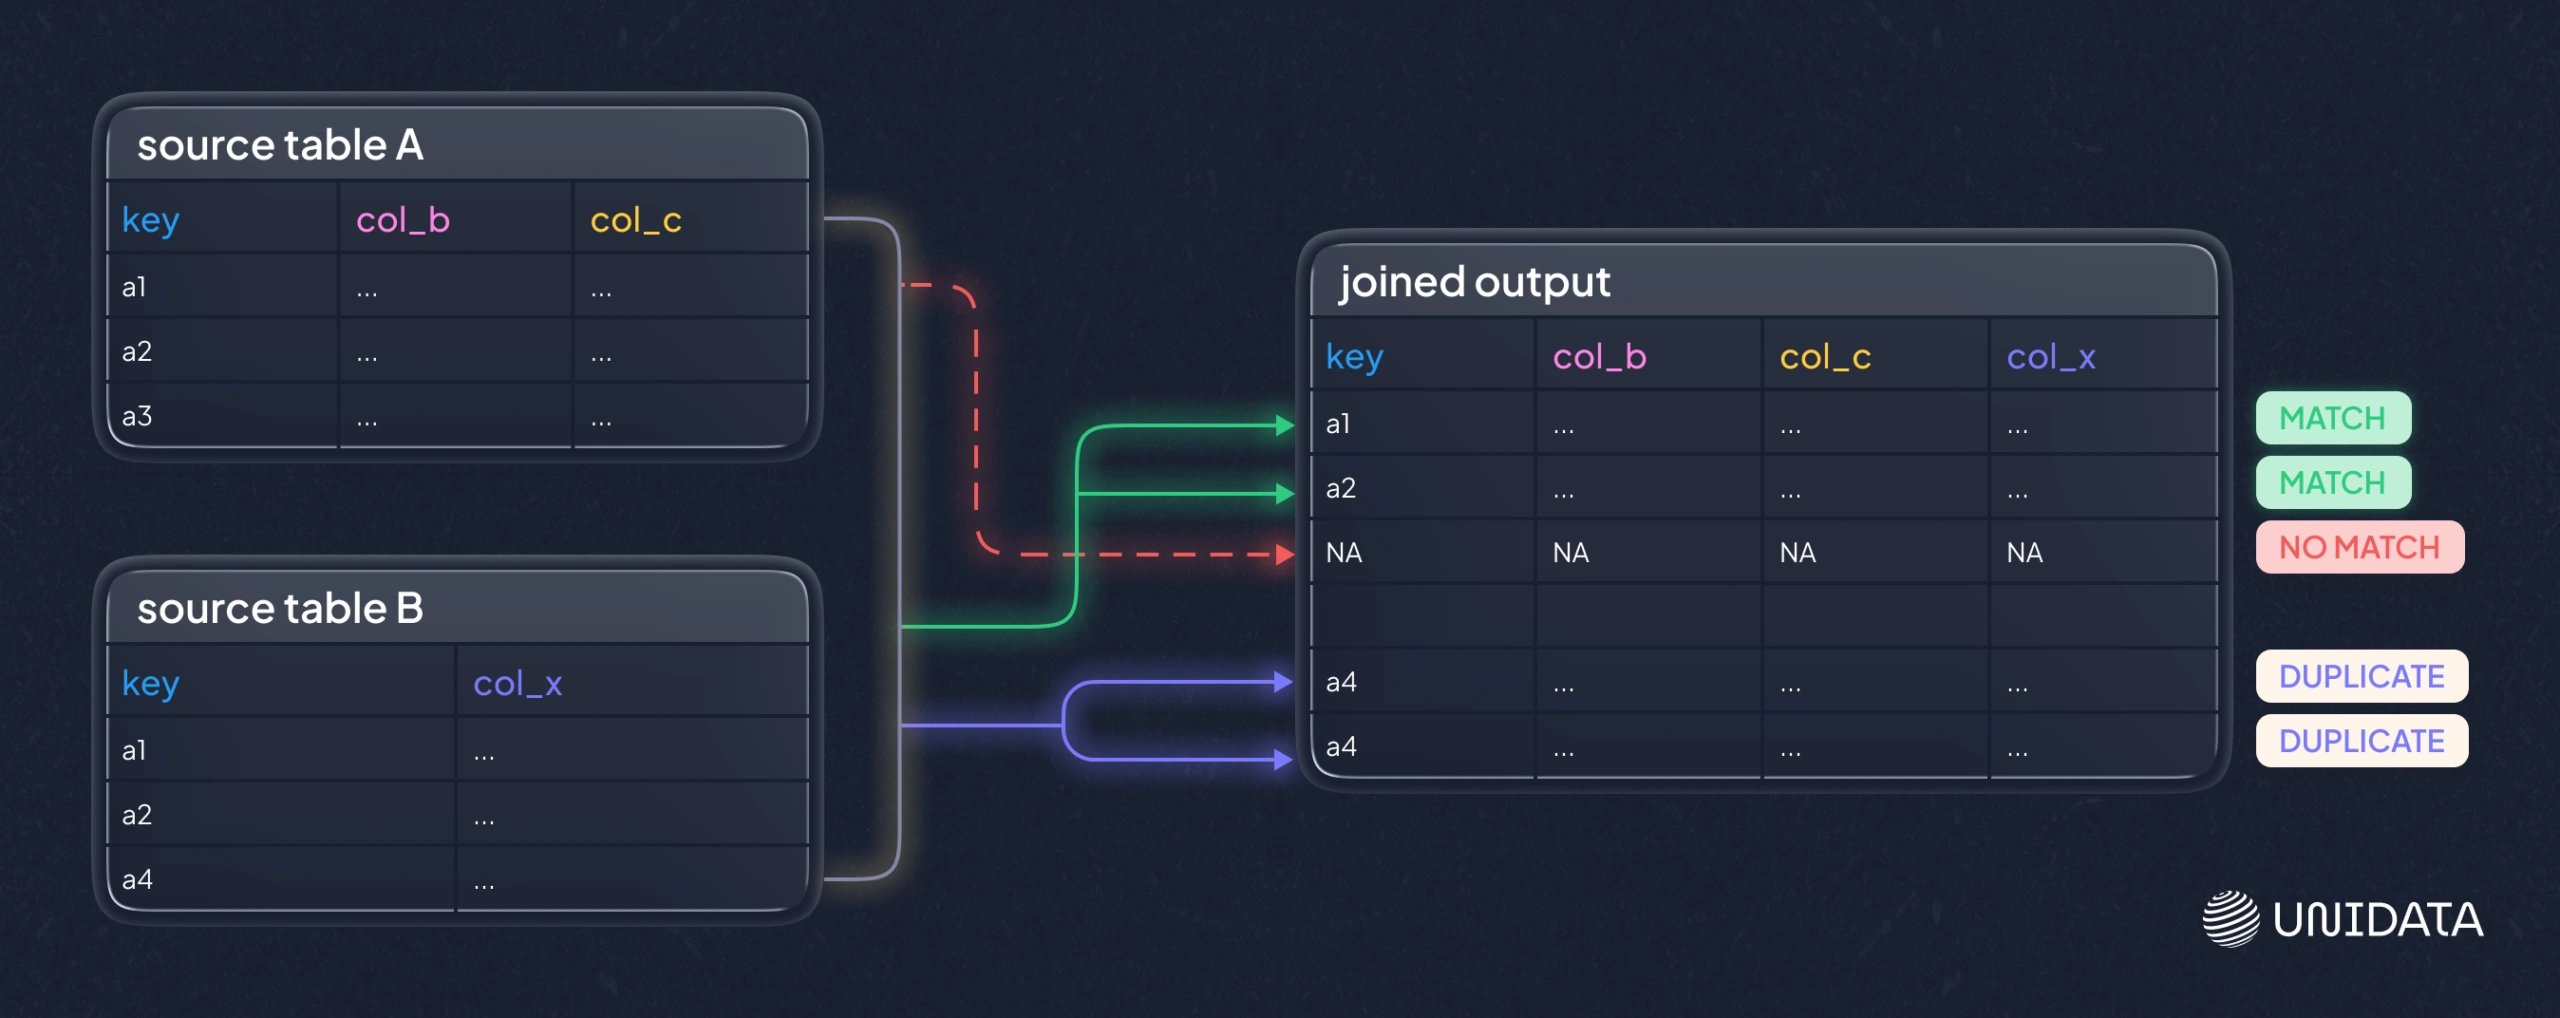
Cross-table profiling (between tables)
This verifies that joins will behave the way you expect, which is critical for warehouses, migrations, and feature tables.
- Foreign keys that do not match any primary key
- Unexpected duplicates across supposed one-to-one mappings
- Many-to-many relationships where you expected a cleaner shape
If cross-table profiling fails, it’s often better to fix the relationship first than to patch symptoms downstream.
Pattern and format analysis
String fields often carry hidden structure. Pattern checks surface inconsistencies such as multiple phone formats, inconsistent casing, or IDs that drift between formats. This is where you discover why a field looks “mostly clean” but still breaks downstream matching.
Rule validation
If you have clear constraints, validate them explicitly so failures become visible and measurable.
- Revenue cannot be negative
- An end date should not precede a start date
- Mandatory fields must be present for certain record types
Rule checks are most useful when they reflect real downstream assumptions. If a rule doesn’t affect anything, it’s usually noise.
Key integrity checks
Keys are load-bearing. If a key is missing or duplicated, everything downstream becomes fragile, especially joins and entity-level reporting.
Profiling highlights null keys, duplicate keys, and suspicious “unique” fields that are not unique so you can decide whether to fix data, redefine keys, or adjust modeling assumptions.
3. Interpret results and prioritize
Profiling tools tell you what they see. They do not know what matters most. Interpretation is where you turn a long report into an actionable plan.
- Which issues change business decisions?
- Which issues break pipelines or models?
- Which issues should be fixed at the source, not patched downstream?
A practical output is a short internal report or ticket list: issue, impact, proposed fix, and owner.
4. Fix, monitor, and re-profile
Profiling is not a one-off step. Data changes. Systems evolve. New sources arrive. After you fix what matters, you re-profile to confirm the fix and to catch regressions.
For large datasets, teams often profile using sampling or incremental checks to stay practical. The key is consistency: checks should run often enough to detect drift before it spreads.
Three profiling lenses: structure, content, and relationships
A useful way to keep profiling work focused is to separate what you’re checking. Each lens has a different “best moment” in a project and a different failure mode if you ignore it.
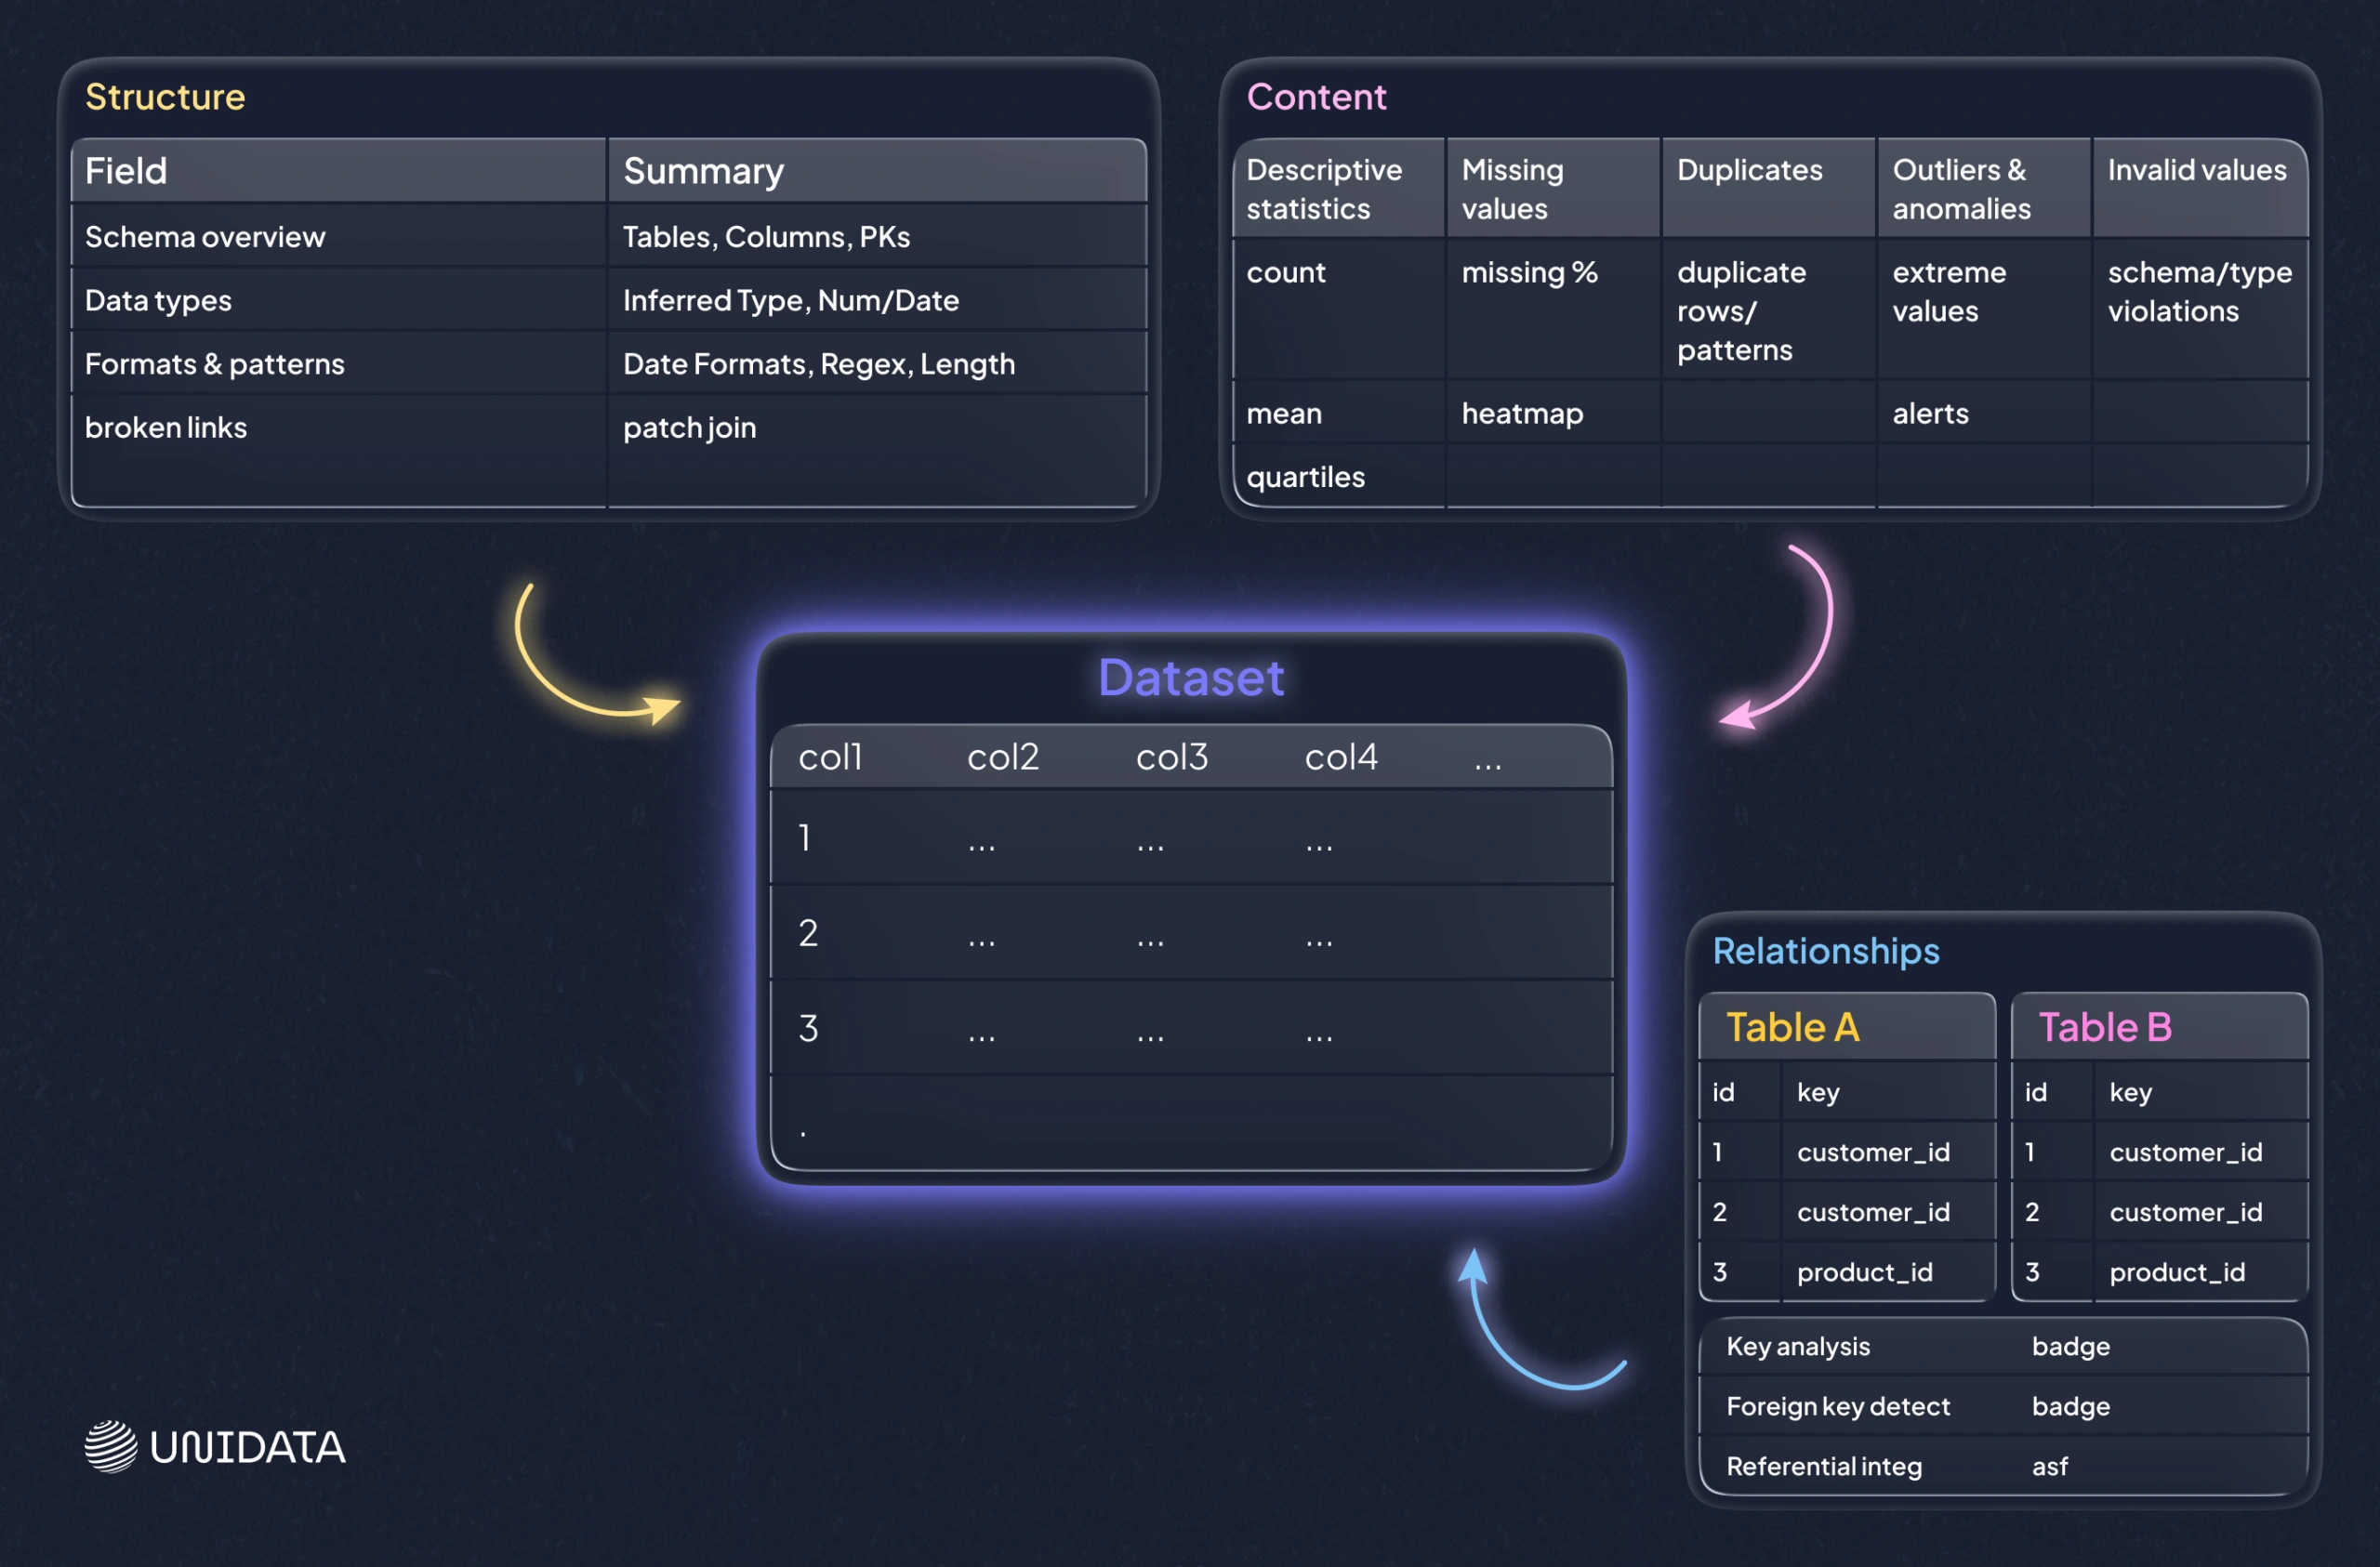
Structure discovery
Structure profiling checks whether the data’s shape matches expectations: types, formats, lengths, and basic conformance. It answers: “Is this dataset shaped like we think it is?”
Use it when onboarding a new source, validating a schema change, or debugging parsing issues. The caveat is that structure can look correct even when values are still semantically wrong, so it’s a starting point, not a finish line.
Content discovery
Content profiling focuses on the values themselves: missingness, duplicates, invalid values, outliers, and records that violate rules. It answers: “What looks wrong at the row and field level?”
Use it when metrics look suspicious, when categories don’t reconcile across reports, or when features behave oddly in ML pipelines.
Relationship discovery
Relationship profiling validates how datasets connect: referential integrity, join completeness, and practical cardinalities. It answers: “Can we trust our joins and our entity graph?”
Use it when building a warehouse, integrating systems, or assembling training data from multiple tables. The caveat is that real systems often contain legitimate exceptions, so the goal is to quantify and understand breakage, not to assume every violation must be “cleaned away.”
In real projects, you rotate between these lenses. A structural mismatch can create content problems, and content anomalies often reveal relationship breakage once you start joining tables.
Where data profiling shows up most
Data profiling is useful almost anywhere data is used, but some workflows benefit disproportionately. Think of these as the places where a small profiling effort prevents large downstream pain.
Warehouses and BI
Warehouses turn many sources into one shared “truth,” which means small inconsistencies get amplified. Profiling source tables early helps you catch issues that will otherwise surface as stakeholder mistrust later, when it’s harder to unwind.
For BI work, the most common profiling wins are practical: inconsistent identifiers that break joins, missing keys that drop records, and category drift that splits the same business concept into multiple buckets. A simple frequency table can reveal that “United States,” “USA,” and “U.S.” will produce three different bars on a chart unless you standardize them. The caveat is that BI dashboards can look correct even when they are missing a slice of data, so relationship checks and “join completeness” deserve as much attention as per-column stats.
Migrations and integrations
Profiling is how you catch both before you move data into a new system or merge sources after an acquisition.
In migration projects, profiling is especially useful for spotting field overloading (one field used for multiple meanings), inconsistent encodings, and schema mismatches such as different data types or length limits for the same attribute. A practical example is a legacy free-text field that contains mixed formats and occasional notes; it may load into a stricter target schema, but you lose structure or truncate values. The caveat is that migrations often involve mapping logic and transformations, so profiling should be done both on the raw source and on the transformed output to confirm the mapping did what you intended.
Analytics and reporting
When a new dataset lands on your desk, profiling is the fastest way to learn what you’re dealing with. It shows you where analysis will be misleading without cleanup, and it helps you avoid building reports on top of hidden quirks.
Typical “first-hour” checks include missingness patterns, top values in categorical fields, and sanity checks for ranges. These quickly reveal whether you are looking at a clean measurement field or something that contains placeholders and mixed units. The constraint here is simple: profiling can tell you the data’s internal consistency, but it can’t validate real-world correctness without an external reference. It still saves time because it tells you which assumptions are safe and which need confirmation.
Governance and compliance work
Governance relies on visibility. Profiling helps you identify sensitive data showing up in unexpected places and measure whether mandatory fields meet internal standards, which is hard to do by policy alone.
In practice, this often means pattern checks over text fields and completeness checks on required attributes. For example, profiling may reveal that a “notes” field is being used to store identifiers or personal details that should be in controlled fields. The caveat is that governance profiles can create noise if they aren’t tied to specific policies and thresholds. It’s better to start with a small set of regulated fields and expand coverage as the workflow becomes repeatable.
Limits and pitfalls to plan for
Scale and cost
Profiling very large datasets can be expensive. Full scans may be slow, and sampling can miss rare issues. Teams often combine sampling with targeted full checks on critical fields, such as keys and high-impact metrics.
A practical approach is to profile broadly with a sample to understand shape and common values, then run full scans only where failure would be costly: primary keys, foreign keys, and fields used in core reports or model features. The caveat is that sampling can underrepresent edge cases. If rare errors matter (for example, compliance or fraud-related signals), targeted full checks become more important.
Access and silos
Profiling requires visibility. If key sources are gated behind permissions or organizational boundaries, you get partial truth. Partial profiling can create false confidence, because the dataset you can access may not include the exact segments where problems hide.
A minimal mitigation is to document coverage: what was profiled, what wasn’t, and what assumptions depend on missing sources. Without that, a profiling report can be misread as “the data is clean,” when it actually means “the accessible slice looks clean.”
Unstructured and semi-structured data
Profiling shines on structured tables. For nested JSON, logs, text blobs, or images, you may need specialized checks, custom parsing, or domain-specific tooling.
The practical issue is that “schema” is often implicit in these formats. Profiling must either infer structure (which can be unstable) or rely on an explicit parsing layer. The caveat is that early-stage profiling here often focuses on shape: field presence, nesting patterns, and key distribution, before it can say anything meaningful about content quality.
Interpretation is not optional
Tools can flag anomalies, but only humans can decide whether something is a real defect or a valid edge case. Without interpretation, profiling becomes noise and teams stop trusting it.
A simple example is outliers: a large value could be a data entry error, a unit mismatch, or a legitimate extreme event. Profiling’s job is to surface the pattern and give you a short list of candidates. Resolution needs domain context and clear ownership of what happens next.
False sense of security
A clean profile does not guarantee correctness. Profiling checks what you measure. If you do not measure bias, leakage, or subtle business logic errors, they can still slip through.
This is why profiling should be aligned with downstream assumptions. If a model depends on stable category sets, profile category drift. If dashboards rely on consistent joins, profile referential integrity. The constraint is not tooling; it’s choosing the right checks so “clean” actually means “safe for this use case.”
Skills and ownership
Profiling requires a person who understands data quality and the domain, plus agreement on who fixes what. Without ownership, profiling reports become shelfware.
The most common failure mode is a report that lists problems but doesn’t connect them to actions: where the fix happens (source system, ingestion, transformation), who owns it, and how you verify it’s resolved. Profiling becomes valuable when findings are converted into tickets, rules, or automated checks that run again.
Myth-busters: common misconceptions
Myth 1: “Profiling is just null counts and basic stats.”
Basic stats are the entry point, not the finish line. Profiling also includes format checks, rule validation, dependency checks, and relationship integrity across tables. In many real failures, the breakage is in joins or inconsistent encodings, not just missing values.
Myth 2: “Profile once at the start and you’re done.”
Data is not static. New records, source system changes, and pipeline updates introduce new failure modes. Profiling works best as a recurring practice, especially for critical tables that feed dashboards or models.
Myth 3: “Profiling tools fix the data.”
Profiling tools mostly diagnose. Fixing requires decisions: standardize, deduplicate, impute, drop, or repair upstream. The tool can point at the problem, but it can’t choose the right trade-off for your business.
Myth 4: “Trusted source systems don’t need profiling.”
Even well-managed systems accumulate drift, user-entry errors, and integration artifacts. Profiling is how you verify that “trusted” remains trusted for your specific use case, especially after schema changes, new integrations, or shifts in how users enter data.
The human factor: why profiling needs judgment
Automated tooling can scan at scale, but it cannot decide which issues are critical. People do that. Humans contribute in three places:
- Defining rules that matter. Tools can infer patterns, but only you know what “valid” means in your business.
- Prioritizing fixes. Not all issues are equal. Some break compliance. Some break joins. Some are cosmetic.
- Avoiding wrong fixes. A profiler might flag duplicates. A domain expert might realize they are distinct entities that happen to look similar.
The best profiling workflows treat tooling as a high-powered microscope and humans as the ones who decide what deserves surgery.
Tooling options and a practical selection checklist
Choosing a profiling solution is less about a perfect feature list and more about fit with your stack and your operating model. Picture it as choosing a vehicle: a sports car is great, unless your job is hauling furniture.
Lightweight and open-source options
These tend to shine for exploratory work and developer-driven pipelines:
- Python profiling libraries that generate dataset summaries and reports from dataframes
- Data validation frameworks that turn profiling insights into repeatable tests
- Interactive cleanup tools that combine profiling-like exploration with hands-on fixes for smaller datasets
They work well when your data lives in notebooks, when datasets are moderate in size, or when you want profiling embedded into CI for data.
Enterprise and platform options
Larger organizations often need:
- Broad connectors across many systems
- Role-based access and governance workflows
- Scorecards and data quality SLAs
- Scheduling, alerting, and reporting for ongoing monitoring
In those cases, profiling becomes one component inside a broader data quality and governance platform.
Cloud-native profiling and observability
If your data sits in cloud warehouses and lakes, cloud-native profiling and observability tools can be efficient because they run close to the data, integrate with your orchestration, and alert on anomalies that matter to pipelines.
A selection checklist
When evaluating tools, focus on these practical questions:
- Scale: Can it profile your largest tables within your time and cost limits?
- Coverage: Does it connect to the systems you actually use?
- Automation: Can you schedule checks and alert on regressions?
- Explainability: Can users trace a metric to specific failing records?
- Workflow fit: Does it integrate with how your team tracks issues (tickets, catalogs, CI)?
- Governance: Does it support your security model and compliance needs?
Many teams end up with a hybrid approach: lightweight profiling for exploration and development, plus scheduled checks for production-grade monitoring.
Conclusion: profiling turns unknown data into workable data
Data profiling is not glamorous, but it is one of the most reliable ways to prevent slow-motion failure in analytics, integration, and ML pipelines. It gives you a clear view of what your data contains, where it breaks expectations, and what to fix first.
If you want profiling to pay off, treat it as a practice, not a checkbox. Profile new sources early. Turn key checks into repeatable tests. Re-profile on a schedule. And make sure someone owns the fixes, not just the findings. If you’re building a data pipeline or assembling training data and want a faster path from “raw tables” to “trusted inputs,” a structured profiling workflow is usually the quickest win.
Frequently Asked Questions (FAQ)
Data profiling is the process of examining a dataset to understand its structure, content, and relationships before you use it in analytics, ETL, or machine learning. A profiling run typically summarizes data types and formats, missing values, duplicates, value distributions, and key or join behavior so you can spot issues early.
Most teams group data profiling into three practical types:
- Structure profiling: checks schema fit, data types, formats, and length constraints.
- Content profiling: checks missingness, invalid values, duplicates, outliers, and category drift.
- Relationship profiling: checks key integrity, referential integrity, and whether joins behave as expected.
Use structure profiling when onboarding or after schema changes, content profiling when values look inconsistent, and relationship profiling before warehousing, integration, or feature table builds.
Data profiling is not ETL itself. ETL extracts, transforms, and loads data into a target system. Profiling is a validation and discovery step often used inside ETL workflows to detect schema mismatches, missing keys, and invalid formats before loading, and to verify that transformations produced clean, consistent outputs.
A common framework describes four types of data analysis:
- Descriptive analysis: summarizes what happened.
- Diagnostic analysis: explains why it happened.
- Predictive analysis: forecasts what is likely to happen.
- Prescriptive analysis: recommends actions to take next.
Data profiling supports these by improving data reliability, but it is not one of the four analysis types.