Retail data is a security camera for your business logic. It quietly records what customers touched, ignored, compared, returned, and bought — and it does not care what your dashboard hoped would happen.
This free-first shortlist covers 20 retail datasets you can use to train models for demand forecasting, recommendation systems, basket analysis, customer segmentation, product recognition, and receipt understanding. Each card calls out the parts that usually break projects: leakage, missing promo context, messy identifiers, and time splits that look clean but lie.
What Counts as a Retail Dataset
A "retail dataset" is rarely one table. It is usually a stack of views on the same reality:
- Transactions and baskets: orders, line items, quantities, prices, discounts, returns.
- Catalog and taxonomy: SKU metadata, category trees, brand, attributes, images.
- Behavior data: page views, sessions, add-to-cart events, searches, clicks.
- Operations: inventory, replenishment, store calendars, promotions, stockouts.
- Retail documents: receipts, invoices, product labels, shelf tags, planograms.
- Context: holidays, weather, macro indicators, store geography, foot traffic proxies.
If you have only one of these layers, you can still build useful models — just be honest about what the data cannot explain.
What You Can Build with Retail Data
| ML task | What you need from the data | Typical model type |
|---|---|---|
| Demand / inventory forecasting | Time series with promo + calendar context | LightGBM, NHITS, Temporal Fusion Transformer |
| Recommendations | User–item interaction histories (clicks, purchases) | Matrix factorization, GRU4Rec, SASRec |
| Basket analysis | Transaction logs with line items | Apriori, co-occurrence embeddings |
| Customer segmentation | RFM signals, behavioral history | K-means, hierarchical clustering |
| Retail computer vision | Labeled shelf or checkout images | YOLO, Faster R-CNN, ViT |
| Receipt / invoice understanding | Annotated scan images with field labels | LayoutLM, Donut, PaddleOCR |
How to Choose a Retail Dataset without Wasting a Week
1) What is the prediction target, exactly
"Sales forecasting" can mean daily unit sales per store, next-week revenue per category, or next-basket items per user. Pick a dataset where the target is natural to the data structure, not forced. If you need to engineer the target variable from scratch, you lose a week before a single model runs.
2) Is there a clean time axis
Retail models fail when future and past are mixed. Prefer datasets with timestamps that allow strict temporal splits — train on earlier periods, test on later ones. A random 80/20 split will always inflate metrics because it leaks seasonality and promotion patterns into training.
3) Do you get the context that drives behavior
Promotions, price changes, stockouts, and holidays often explain more variance than your model architecture. If those fields are missing, your model learns a world that does not exist and generalizes to nowhere. Check for supplemental context files before committing to a dataset.
4) Are IDs stable and joinable
Look for stable keys: user_id, session_id, item_id, store_id. If the dataset hashes identifiers without a join table, confirm you can still link events to products. Some datasets look relational until you try to actually join them.
5) What is the license and access friction
Some datasets are free but require accounts. Some are non-commercial only. Some are third-party mirrors of datasets that have since changed access terms. Verify the original source license before building a pipeline — "research-only" may not work if you plan to ship.
Demand Forecasting and Sales Prediction
M5 Forecasting — Accuracy (Walmart)
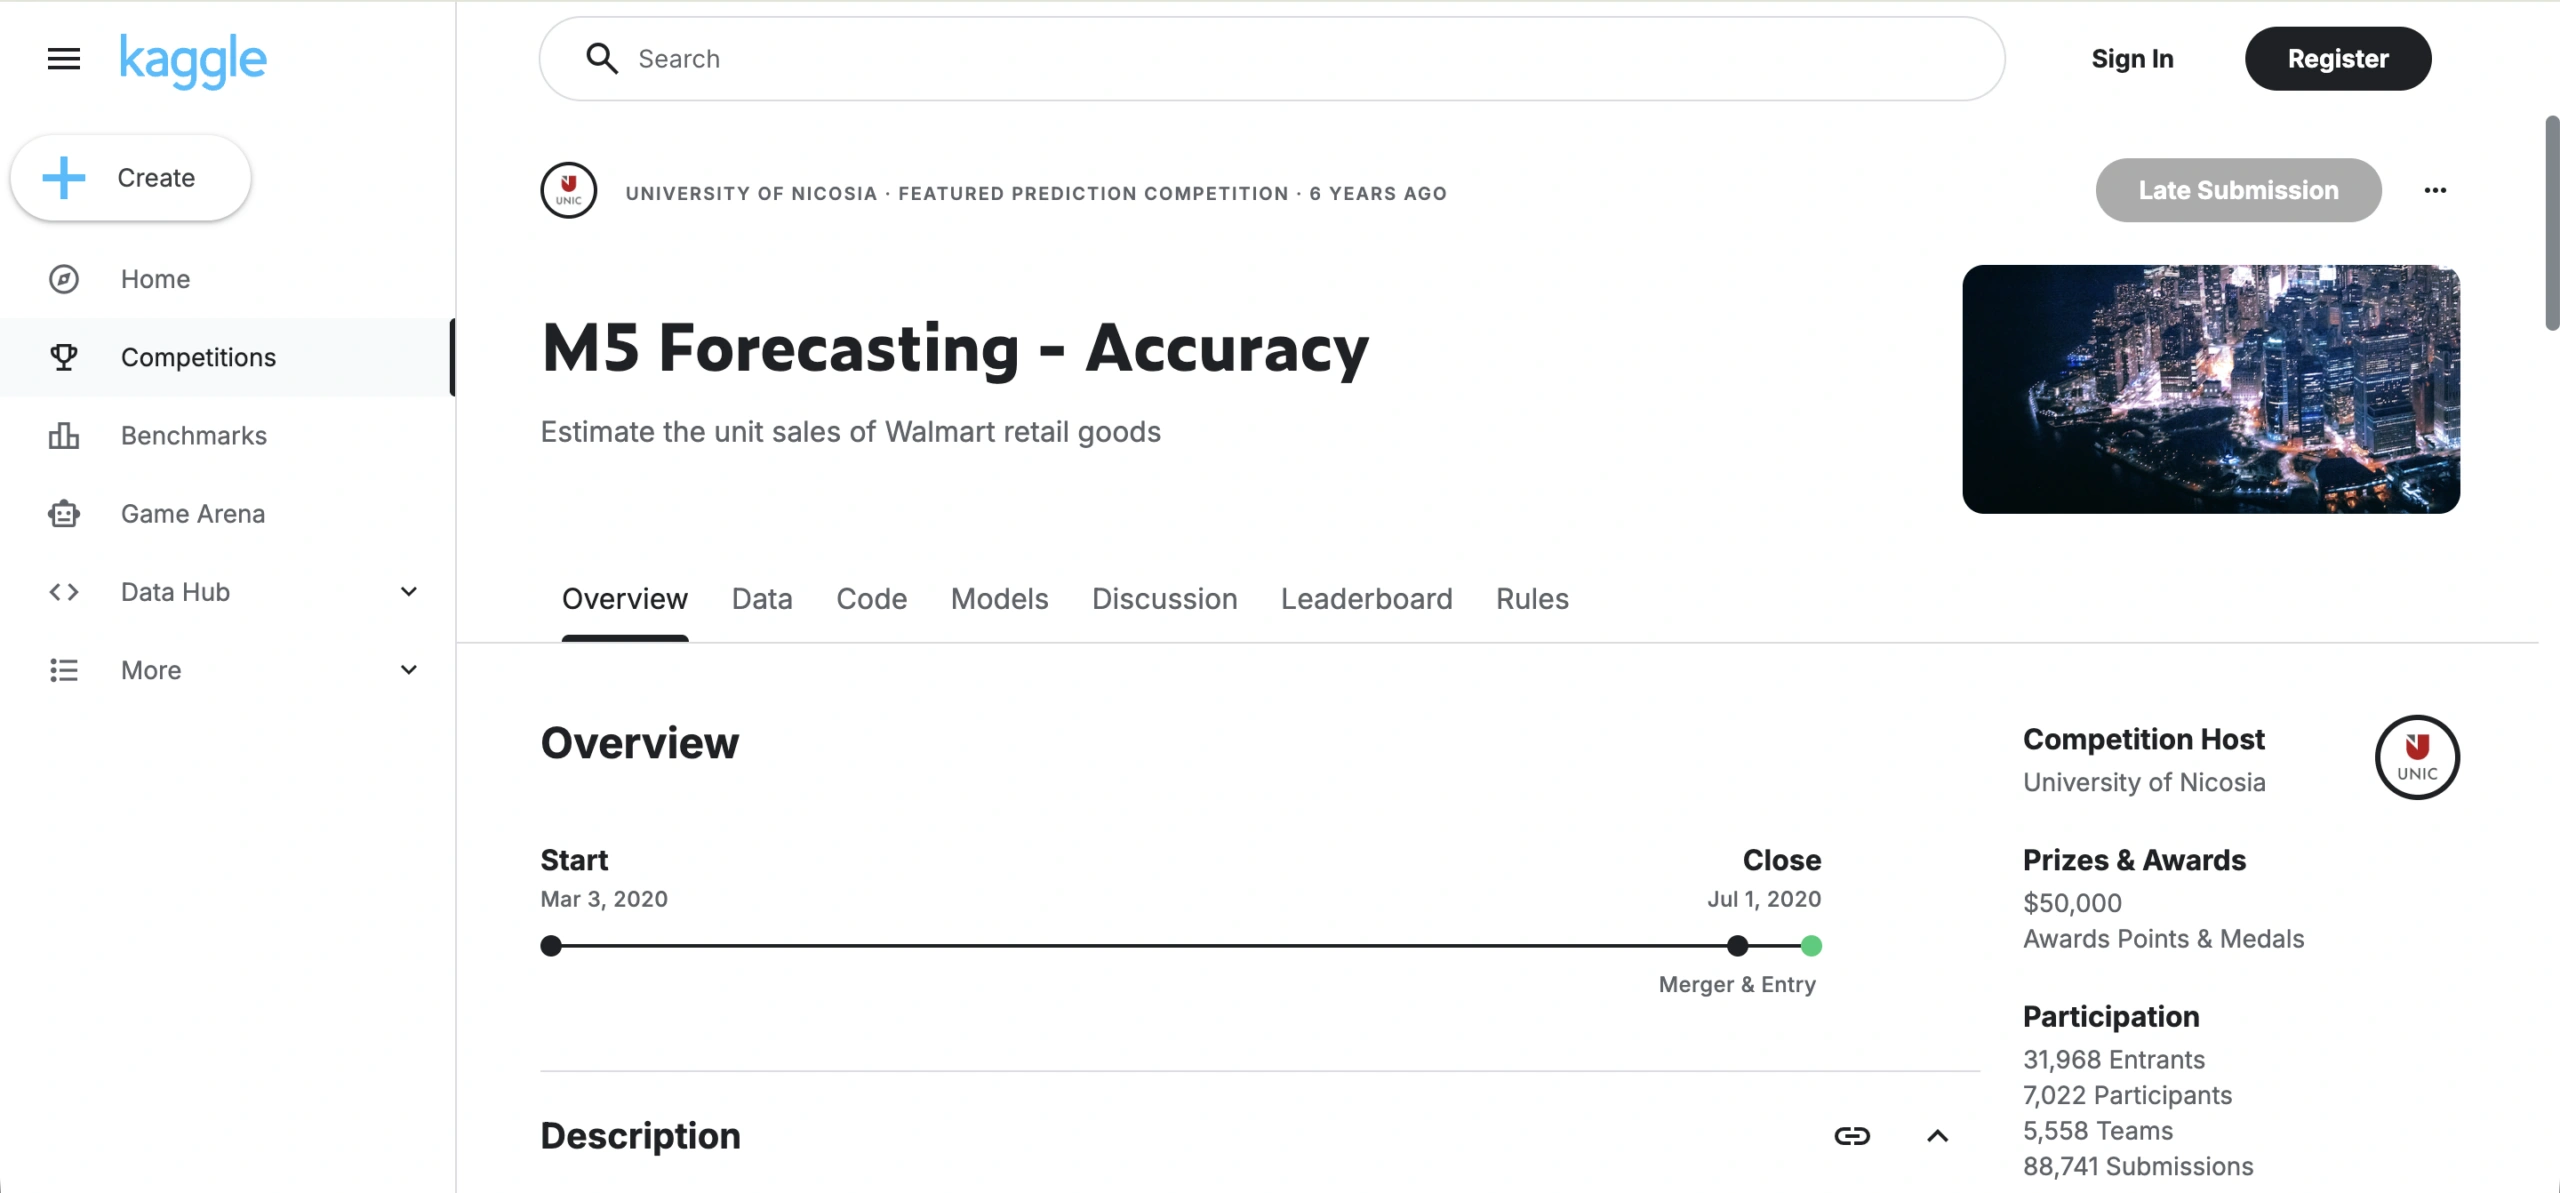
Volume: 30,490 time series × 1,941 days; item-level daily unit sales across 10 Walmart stores in 3 U.S. states
Access: Free (Kaggle account required)
Format: CSV
Task Fit: Hierarchical demand forecasting, feature engineering for retail, backtesting
M5 is the benchmark for retail demand forecasting. The three-level hierarchy — item, department, store, state — forces you to think about how forecasts should aggregate and reconcile, and there is a large library of published baselines to compare against. Use it to build and validate a forecasting pipeline before moving to proprietary store data. The main gotcha: promotional and calendar effects are in supplemental files that most teams process too late. Build your feature pipeline around those files first, then train the model.
Corporación Favorita Grocery Sales Forecasting
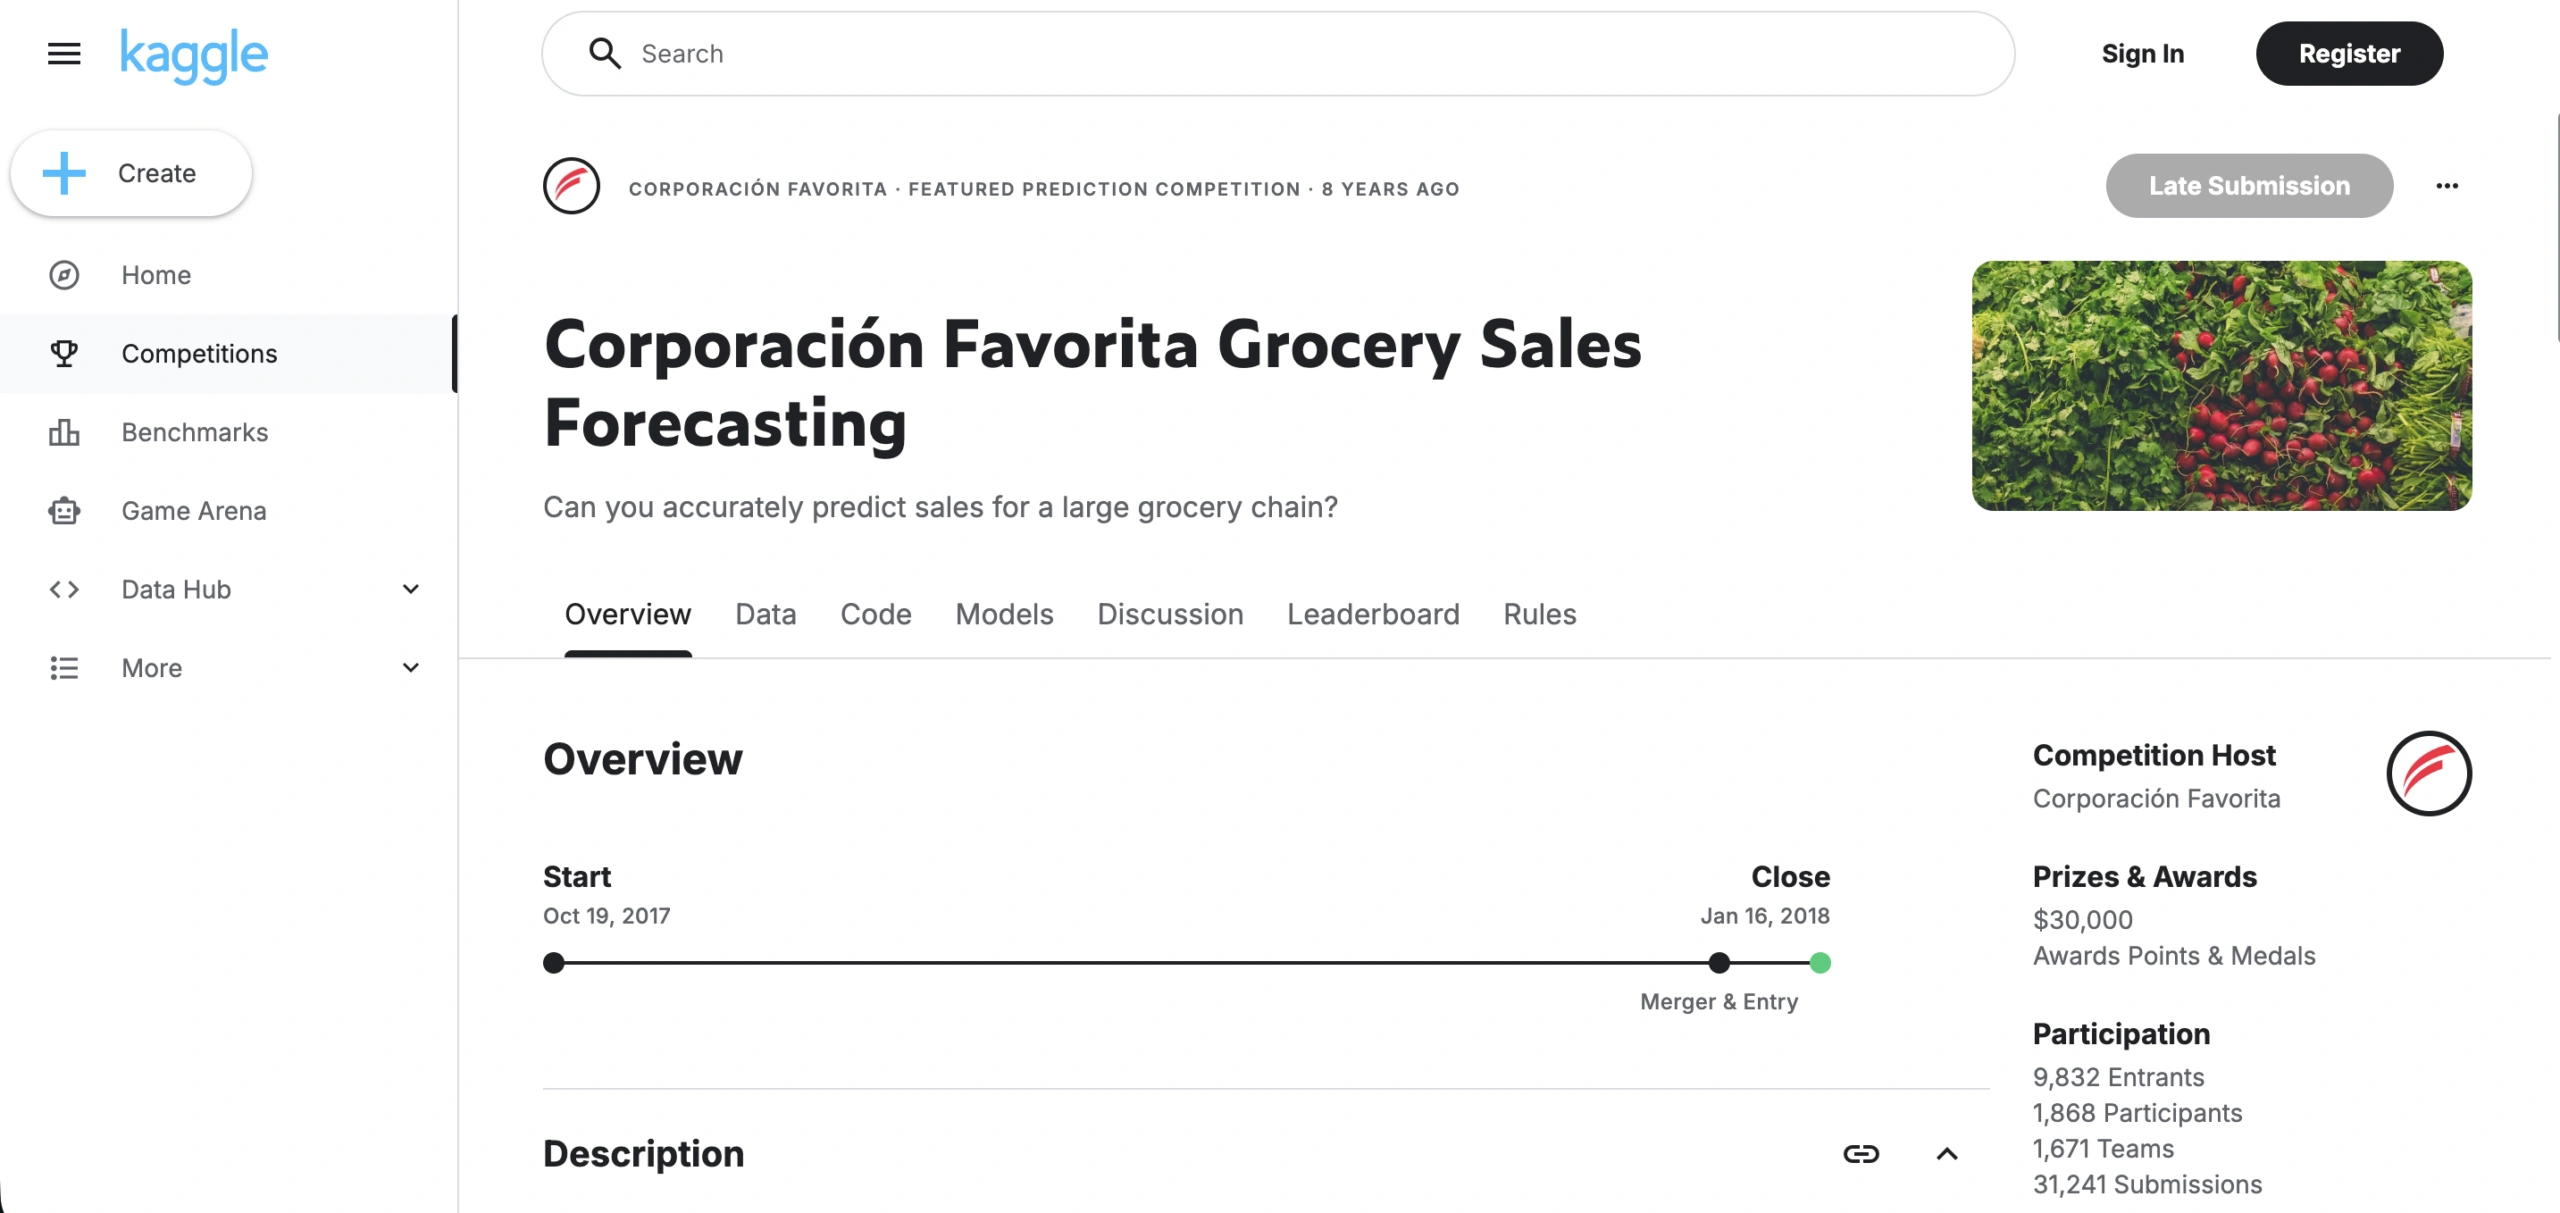
Volume: ~125M rows; 4,100 SKUs across 54 stores; 5 years of daily sales (2013–2017)
Access: Free (Kaggle account required)
Format: CSV
Task Fit: Promo-aware demand forecasting, multi-store modeling, seasonality
Favorita is a messier, more realistic alternative to M5 when you need promo-aware forecasting at scale. The supplemental files — holiday calendars, oil prices, store metadata — reward teams who treat demand as a feature engineering problem, not a time series modeling problem. Grocery sales have heavier substitution effects than general merchandise: if you evaluate on aggregate error only, your model may look fine while failing individual SKUs. Track per-SKU error distributions.
Rossmann Store Sales
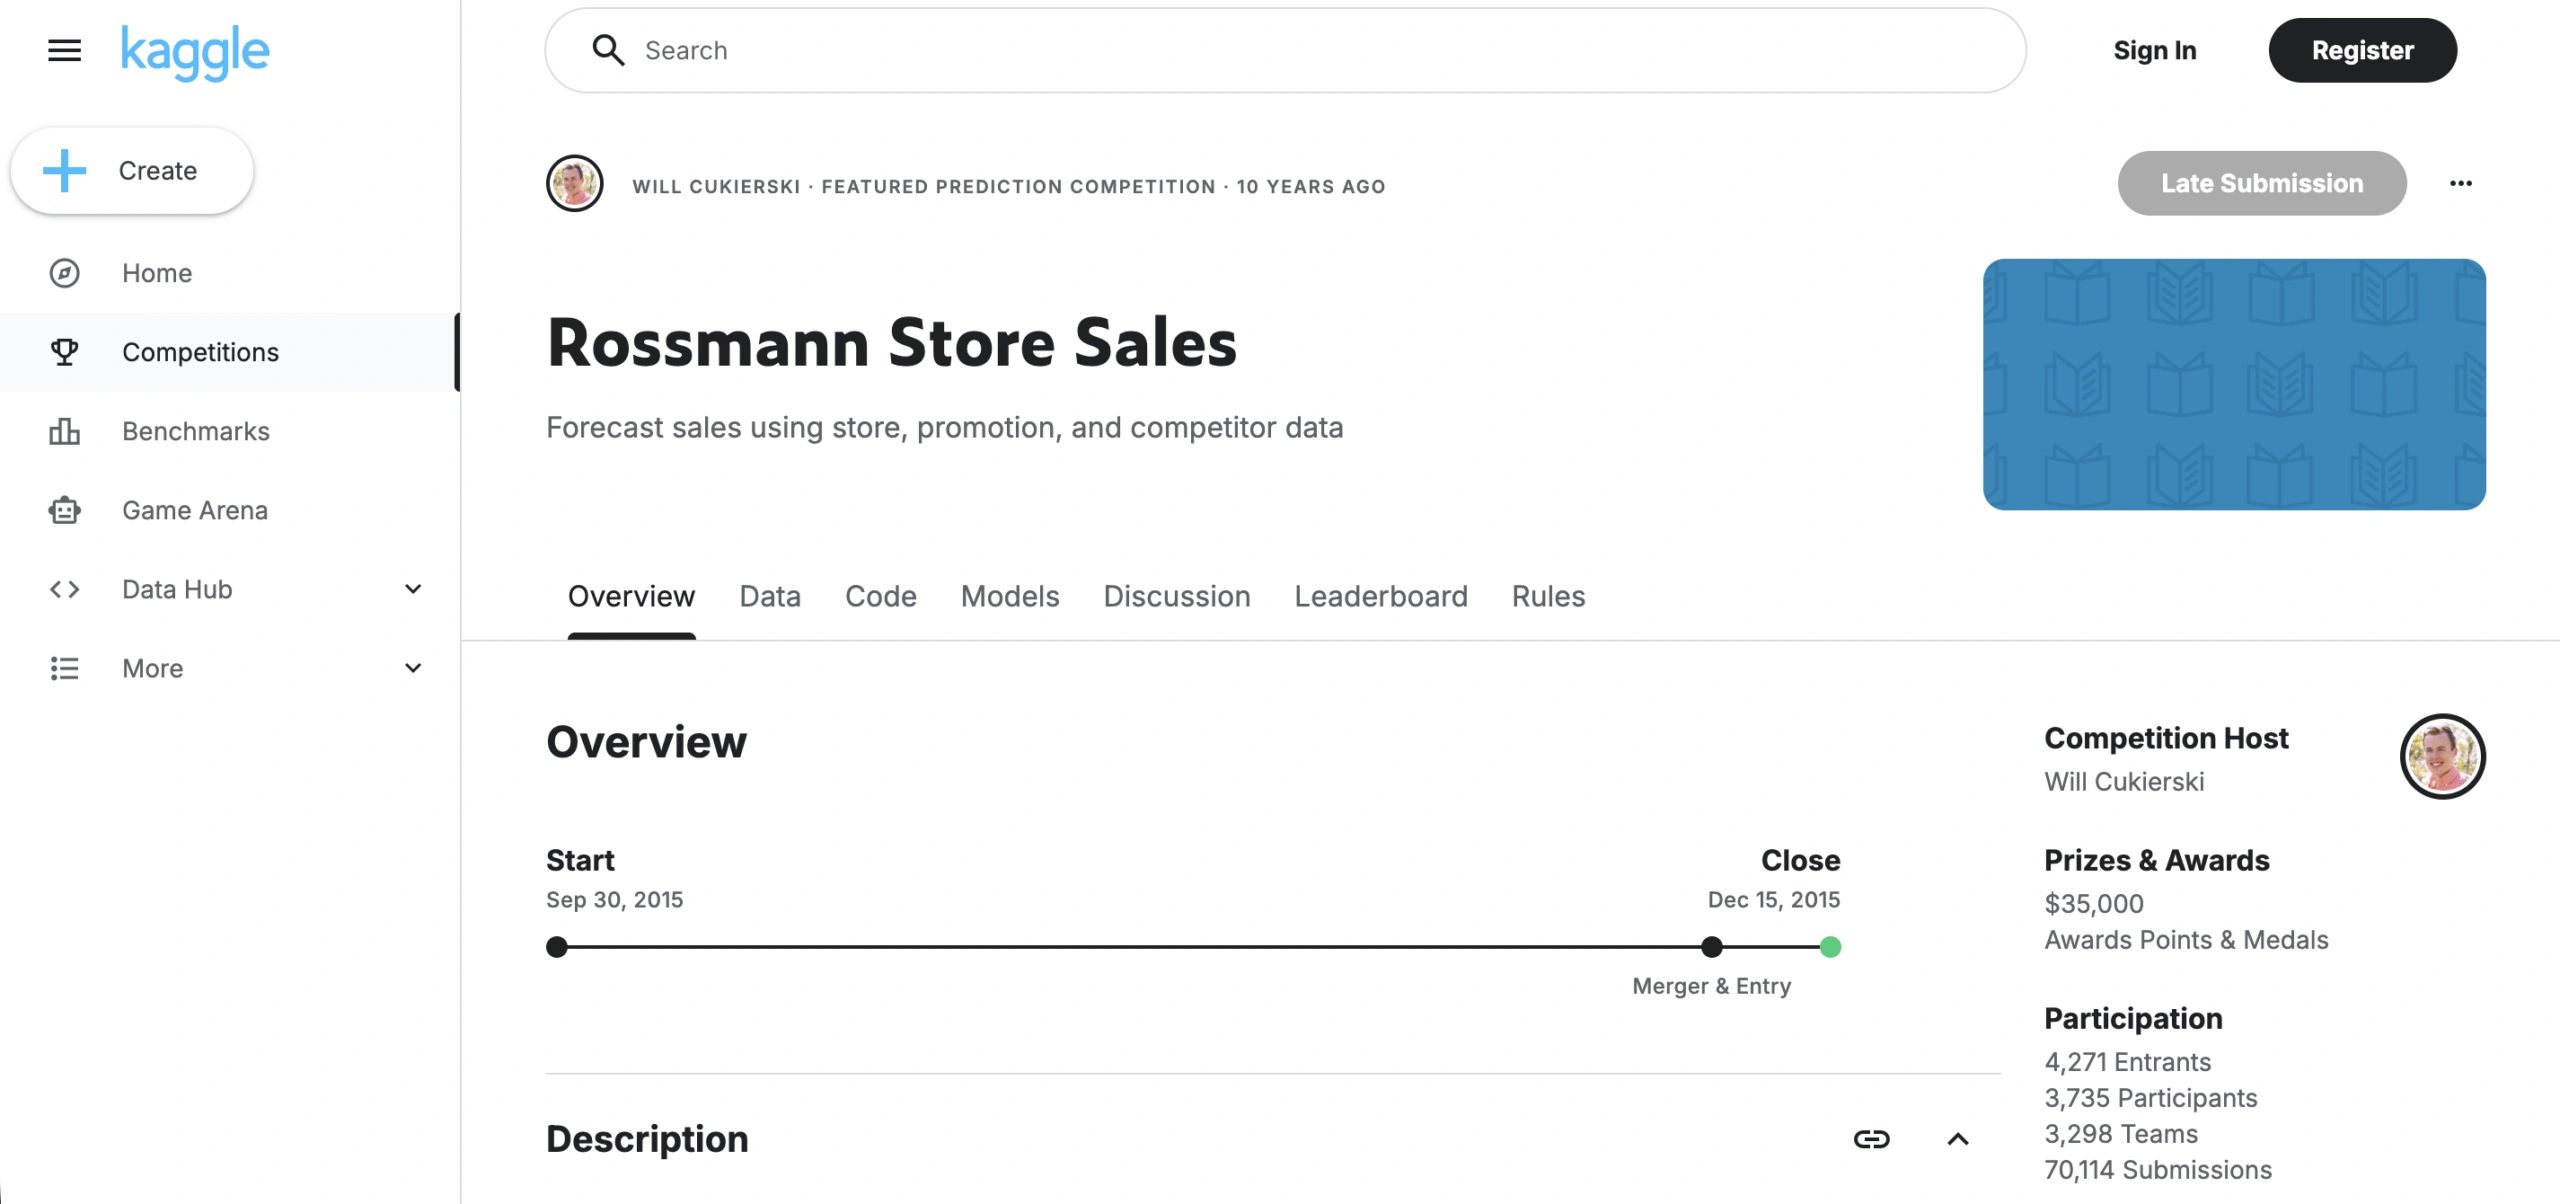
Volume: 1,017 stores; 2.5 years of daily data; ~1M rows; store metadata and promo flags included
Access: Free (Kaggle account required)
Format: CSV
Task Fit: Store-level forecasting, calendar effect modeling, feature engineering practice
Rossmann is the entry point for retail forecasting — small enough to train quickly, documented enough to find working baselines, real enough to surface pipeline mistakes. It is commonly used to teach temporal validation because the dataset is approachable and the community has been active for over a decade. The key trap is missing days: store closures appear as gaps, not zeros. Treat missing entries as an explicit feature class, not an imputation problem.
UCI Hierarchical Sales Data
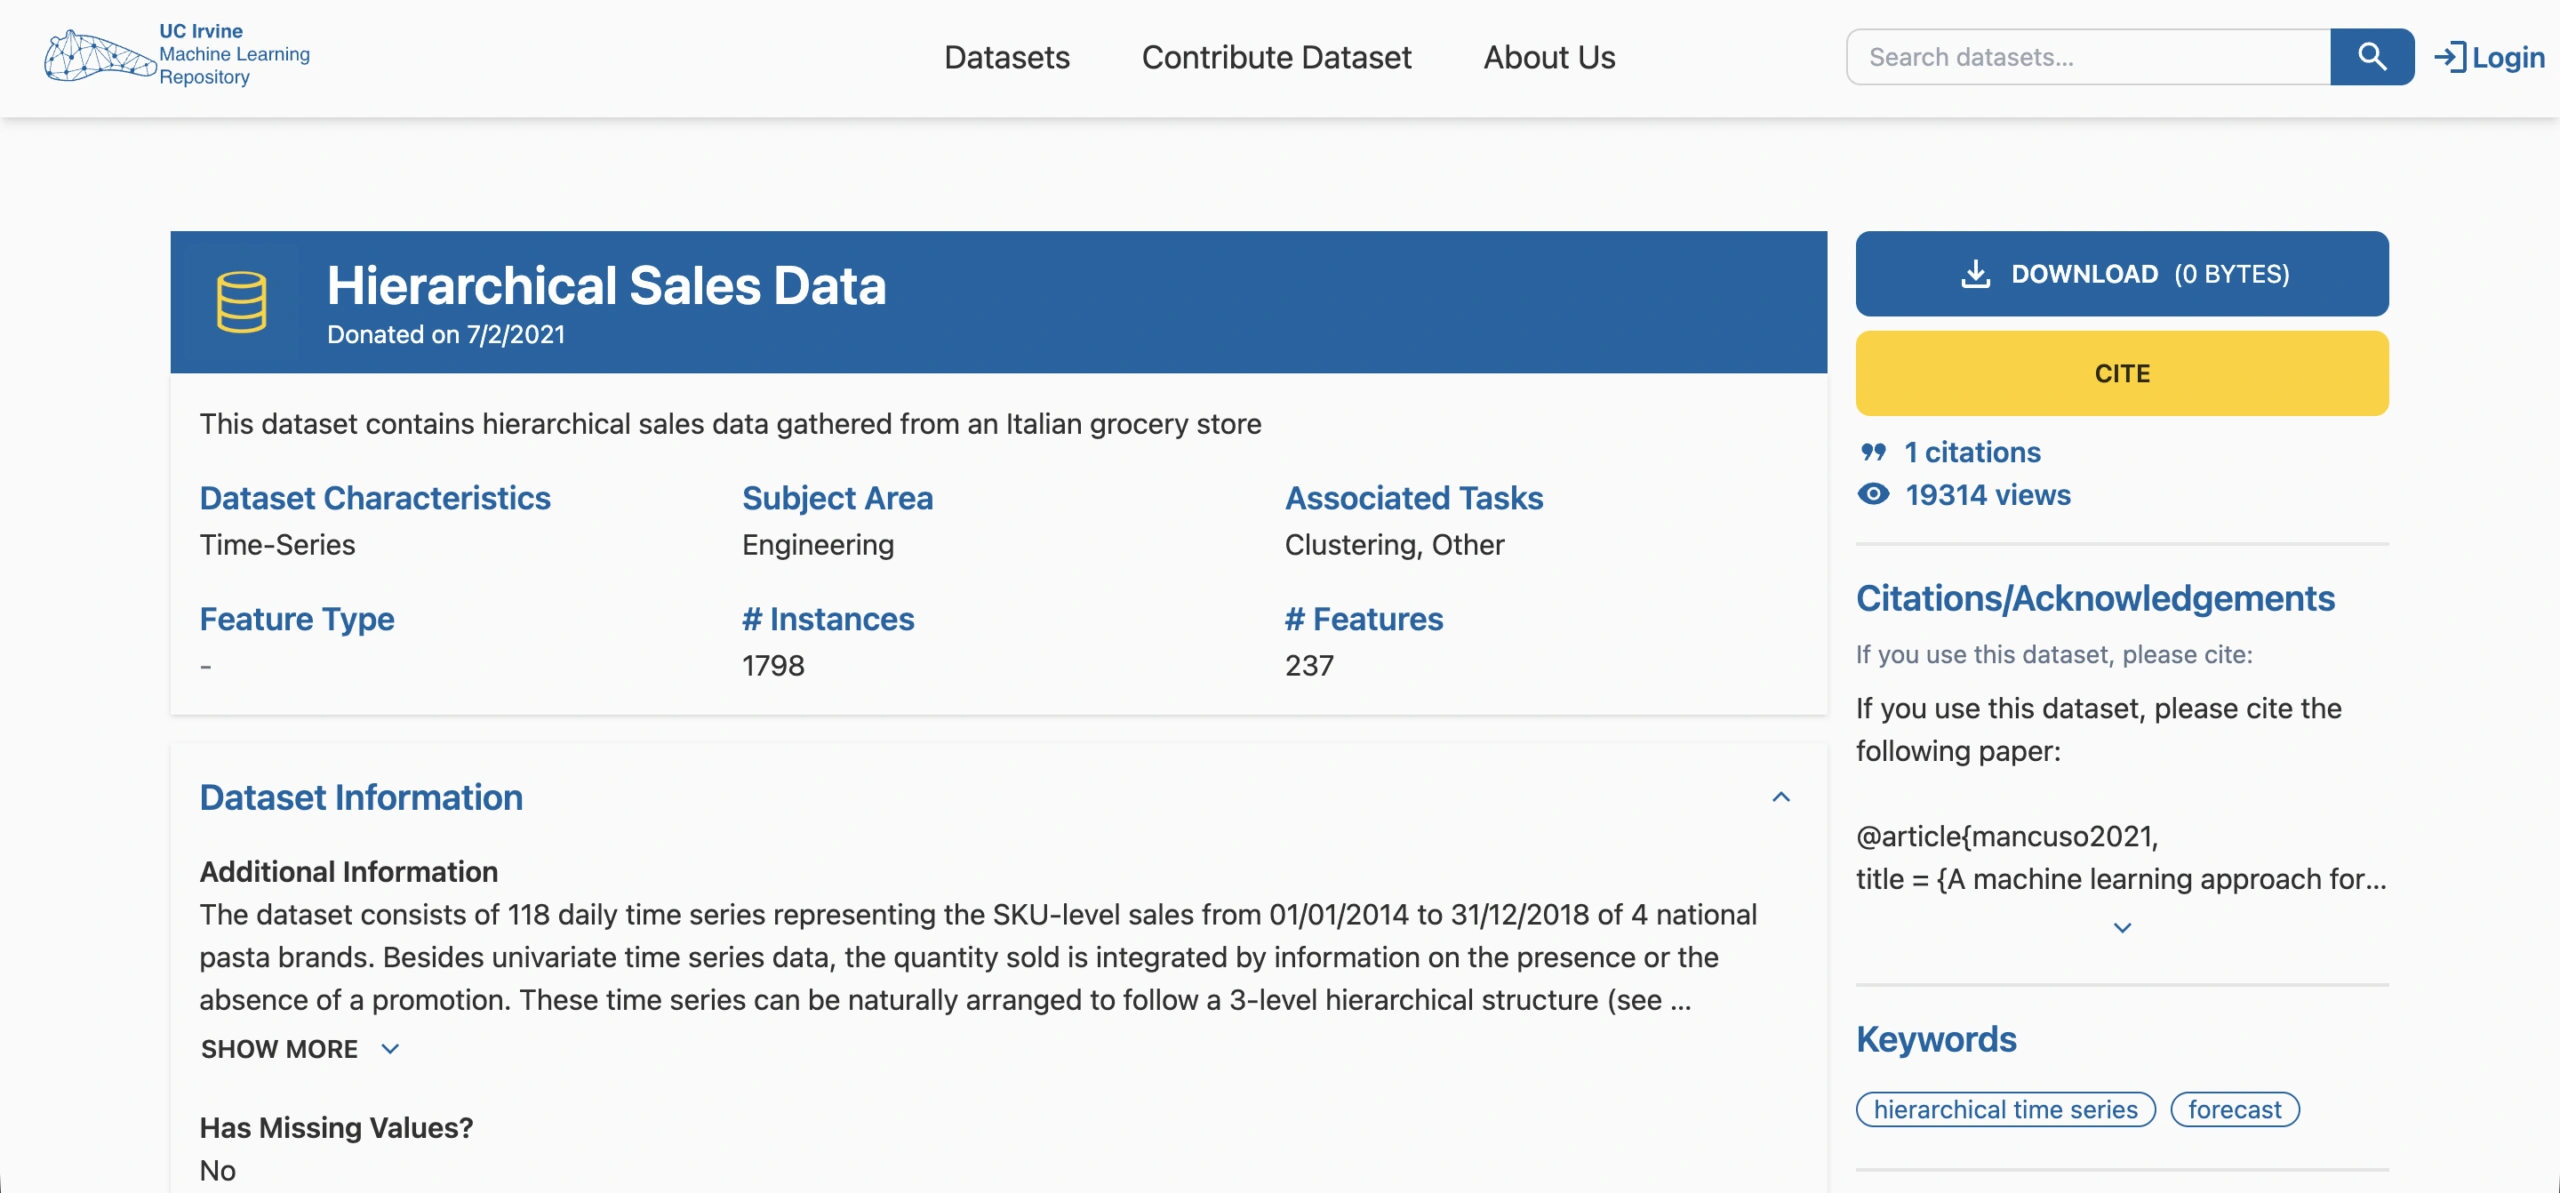
Volume: Compact benchmark; designed for reconciliation testing rather than scale
Access: Free
Format: CSV
Task Fit: Hierarchical forecasting, reconciliation strategies (bottom-up, top-down, MinT), method comparison
This dataset exists specifically for testing reconciliation approaches — whether bottom-up, top-down, or optimal methods like MinT. Its small size is intentional: fast iteration on method comparison, not production-scale training. Use it to confirm your reconciliation strategy does not degrade aggregate accuracy before running M5. The smaller the dataset, the easier it is to overfit with feature-heavy models — keep baselines honest.
U.S. Census Monthly Retail Trade
Volume: Monthly from 1992–present; sector-level aggregate sales and inventory estimates by retail category
Access: Free
Format: CSV via API
Task Fit: Exogenous regressor for demand models, macro context features, regime shift detection
Census Monthly Retail Trade is not a SKU-level dataset — it is aggregate sales data by retail sector. Its value is as an exogenous context signal: macro cycles, regime shifts, and category-level momentum that store-level data does not capture on its own. Use it as a regressor alongside your primary sales dataset. Do not use it as a standalone prediction target; the aggregation hides exactly the store-level and SKU-level variance your model needs to learn.
Transactions, Baskets, and Customer Behavior
Instacart Online Grocery Shopping
Volume: 3.4M orders; 206K users; 50K products; prior order histories included alongside next-basket targets
Access: Free (Kaggle account required)
Format: CSV (relational — orders, products, departments, aisles join tables)
Task Fit: Next-basket prediction, reorder modeling, basket analysis, product affinity
Instacart is the strongest public dataset for next-basket prediction. The relational structure — orders, product metadata, department and aisle hierarchies, reorder flags — lets you build a clean multi-table schema before touching any model code. Reorder flags are genuine signals, not derived. The main constraint is retailer scope: this is one online grocery fulfillment model, so substitution logic, impulse buys, and in-store browse behavior are absent by design. Validate any behavioral assumptions against your own retailer's context before generalizing.
Dunnhumby "The Complete Journey"
Volume: ~2,500 households; 2 years of transactions; 8 tables including campaigns, coupons, products, and household demographics
Access: Free with signup (research and non-commercial use)
Format: CSV (relational — 8 tables, requires joins)
Task Fit: Customer segmentation, CLV modeling, promotion lift, coupon response, basket analysis
Dunnhumby is the richest public retail dataset for customer analytics. Household demographics, coupon redemption records, and campaign exposure logs make promotion-response modeling possible in ways most public datasets cannot support. The dataset is genuinely multi-table: careless joins multiply rows and corrupt aggregates. Validate join cardinality before you build training features. The 2-year window is also modest for long-horizon CLV modeling — supplement with synthetic cohort extension if you need more purchase history per customer.
Online Retail II (UCI)

Volume: ~1M transactions; 5,628 customers; 2009–2011; UK-based online gift wholesaler Access: Free
Format: XLSX (CSV-convertible)
Task Fit: RFM segmentation, basket analysis, customer churn, cohort modeling
Online Retail II is a clean transaction log — line items, quantities, prices, customer IDs, and invoice timestamps across two years. It is standard for RFM analysis and market basket mining. The main limitation is retailer type: a gift wholesaler operates on bulk-order logic with a B2B-skewed customer base, which differs substantially from grocery, fashion, or general merchandise retail. Before drawing behavioral conclusions, confirm whether your domain's purchase patterns hold in this context.
Recommendations and Ranking
YOOCHOOSE (RecSys Challenge 2015)
Volume: 33M click events; 1.15M buy events; ~9M sessions; e-commerce platform (retailer undisclosed)
Access: Free
Format: CSV (two files: clicks log and buy log)
Task Fit: Session-based recommendation, click-through rate prediction, buy conversion modeling
YOOCHOOSE is the standard starting point for session-based recommendation research. The explicit split between click events and buy events lets you model not just what users browse but what they convert on — a more useful training signal for most e-commerce teams. A large library of published baselines exists from 2015 onward. The retailer is not disclosed and item metadata is not provided, which blocks content-aware approaches. Build your session-based baseline here, then validate on a dataset with item features.
RetailRocket E-Commerce Dataset
Volume: 2.8M events; 1.4M unique visitors; ~235K unique items; item category properties included for a subset
Access: Free (Kaggle account required)
Format: CSV (events log + item property tables)
Task Fit: Session-based recommendations, event-level click and purchase modeling, content-aware filtering
RetailRocket is compact enough to train quickly and has the item metadata that YOOCHOOSE lacks — product category and property values for a subset of the catalog. The combination of click, add-to-cart, and transaction events in one log makes funnel-level feature engineering straightforward. The tradeoff is scale: at ~1.4M visitors, the interaction matrix is sparse for long-tail items. Test your model's behavior on those tail items explicitly — they tend to degrade fastest in production.
H&M Personalized Fashion Recommendations
Volume: 31M transactions; 1.37M customers; 105K article IDs; full product images and text descriptions included
Access: Free (Kaggle account required)
Format: CSV + JPEG images
Task Fit: Personalized recommendations, fashion retrieval, next-purchase prediction, cold-start modeling
H&M is one of the few public recommendation datasets that includes both purchase history and full product content — images, text descriptions, and structured attribute metadata. That combination makes it useful for multimodal recommendation research that goes beyond collaborative filtering. Long purchase histories for active customers support cohort and sequence-based modeling. Cold-start is a real problem: a large share of articles have few or no transactions. Explicitly model item cold-start or you will miss a significant product class that matters in production.
Amazon Review Data 2023 (UCSD)
Volume: 571M+ reviews; 2023 release; 33 category subsets available separately; includes user history, item metadata, and review text
Access: Free
Format: JSON/JSONL per category subset
Task Fit: Recommendation research, sentiment classification, review summarization, attribute extraction, demand proxying
Amazon Review Data from UCSD is the largest publicly available review corpus with per-item metadata. The 2023 release adds richer item attributes and user-level review histories compared to the widely used 2018 version. It works well for recommendation research where review text is a content signal and for sentiment or attribute extraction tasks. Reviews are a biased sample of buyers: frequent reviewers and outlier experiences dominate. If you use it for demand proxy modeling, calibrate against actual sales signals before drawing quantitative conclusions.
DIGINETICA — CIKM Cup 2016 Track 2
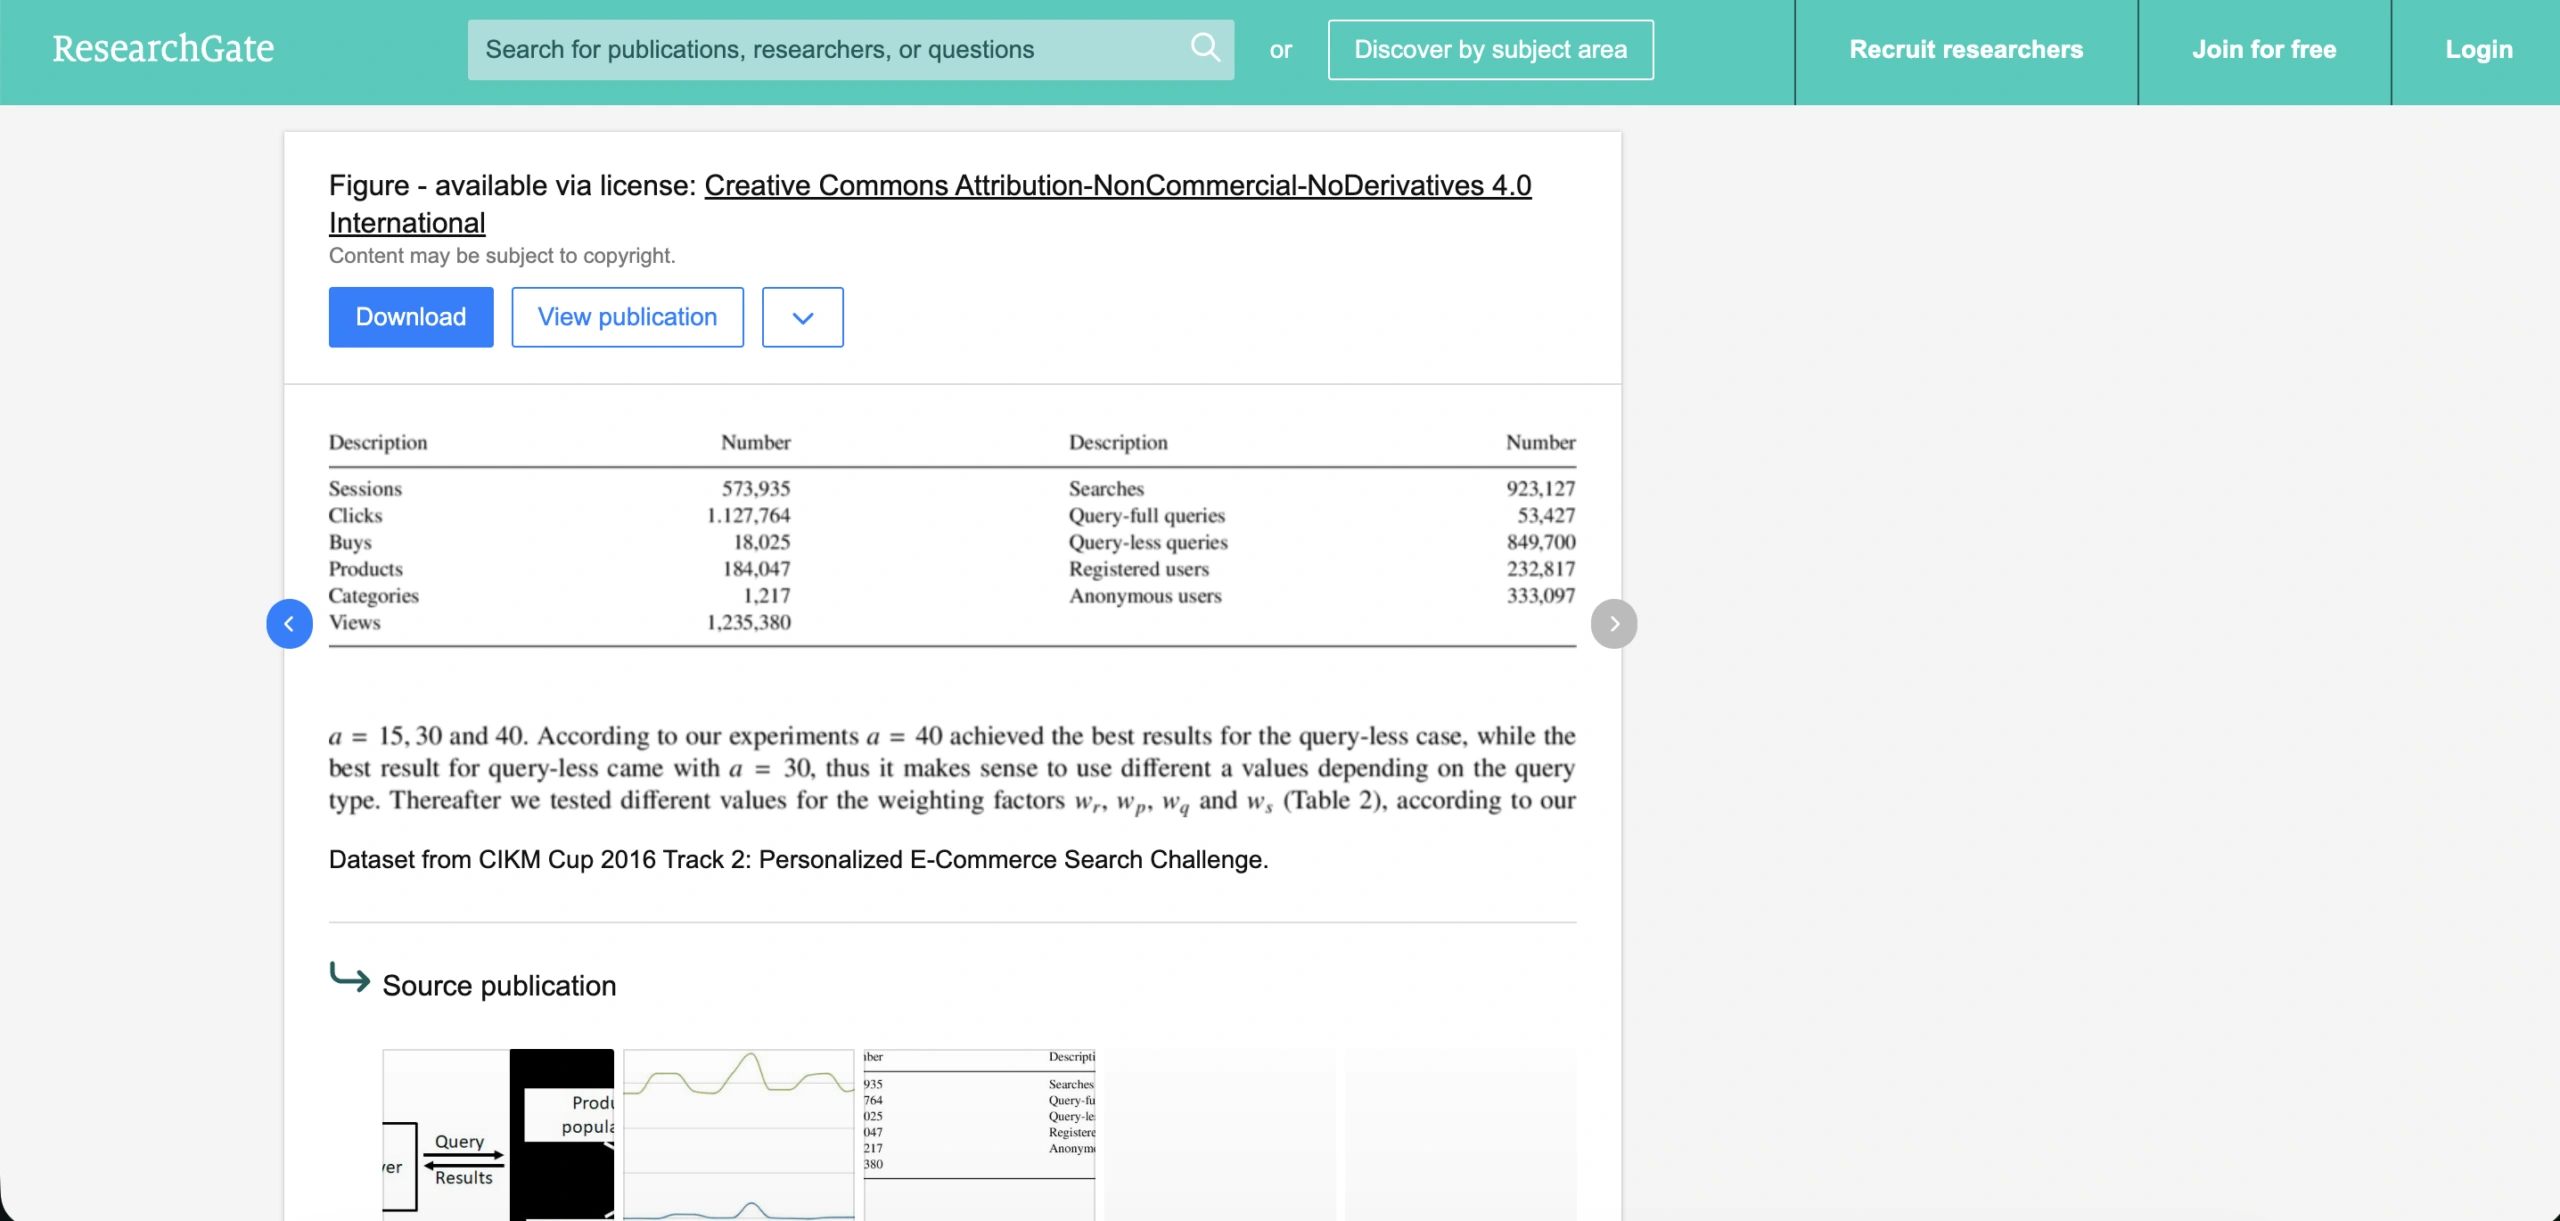
Volume: ~5.3M clicks; ~1.2M queries; ~204K sessions; product categories and price data included
Access: Free
Format: CSV
Task Fit: Session-based recommendations with search context, query-item ranking, e-commerce search modeling
DIGINETICA adds search and browsing logs to the session recommendation problem — useful when you want to model "query intent + item interaction" rather than pure clickstream. The combination of search queries, click sequences, and purchase events supports hybrid session-recommendation and learning-to-rank approaches. The main risk with search log data is position bias: your model may learn the previous ranking system's behavior rather than genuine customer preference. Log the original display position of items shown and control for it if you can.
E-commerce Operations, Product Catalogs, and Web Analytics
Olist Brazilian E-Commerce Public Dataset
Volume: ~100K orders; 8 relational tables (orders, items, payments, reviews, geolocation, sellers); 2016–2018
Access: Free (Kaggle account required)
Format: CSV (relational)
Task Fit: Delivery time prediction, order outcome analysis, seller analytics, multi-table schema practice
Olist is a realistic multi-table e-commerce dataset with orders, products, payments, logistics estimates, and review scores. It is useful for teams building delivery prediction, marketplace health scoring, or churn models — tasks that require multiple entity types joined together. The Brazilian e-commerce context means logistics patterns and geography play a first-class role. Multi-table joins can silently multiply rows: run a sanity-check query on cardinality before building any training features.
Open Food Facts
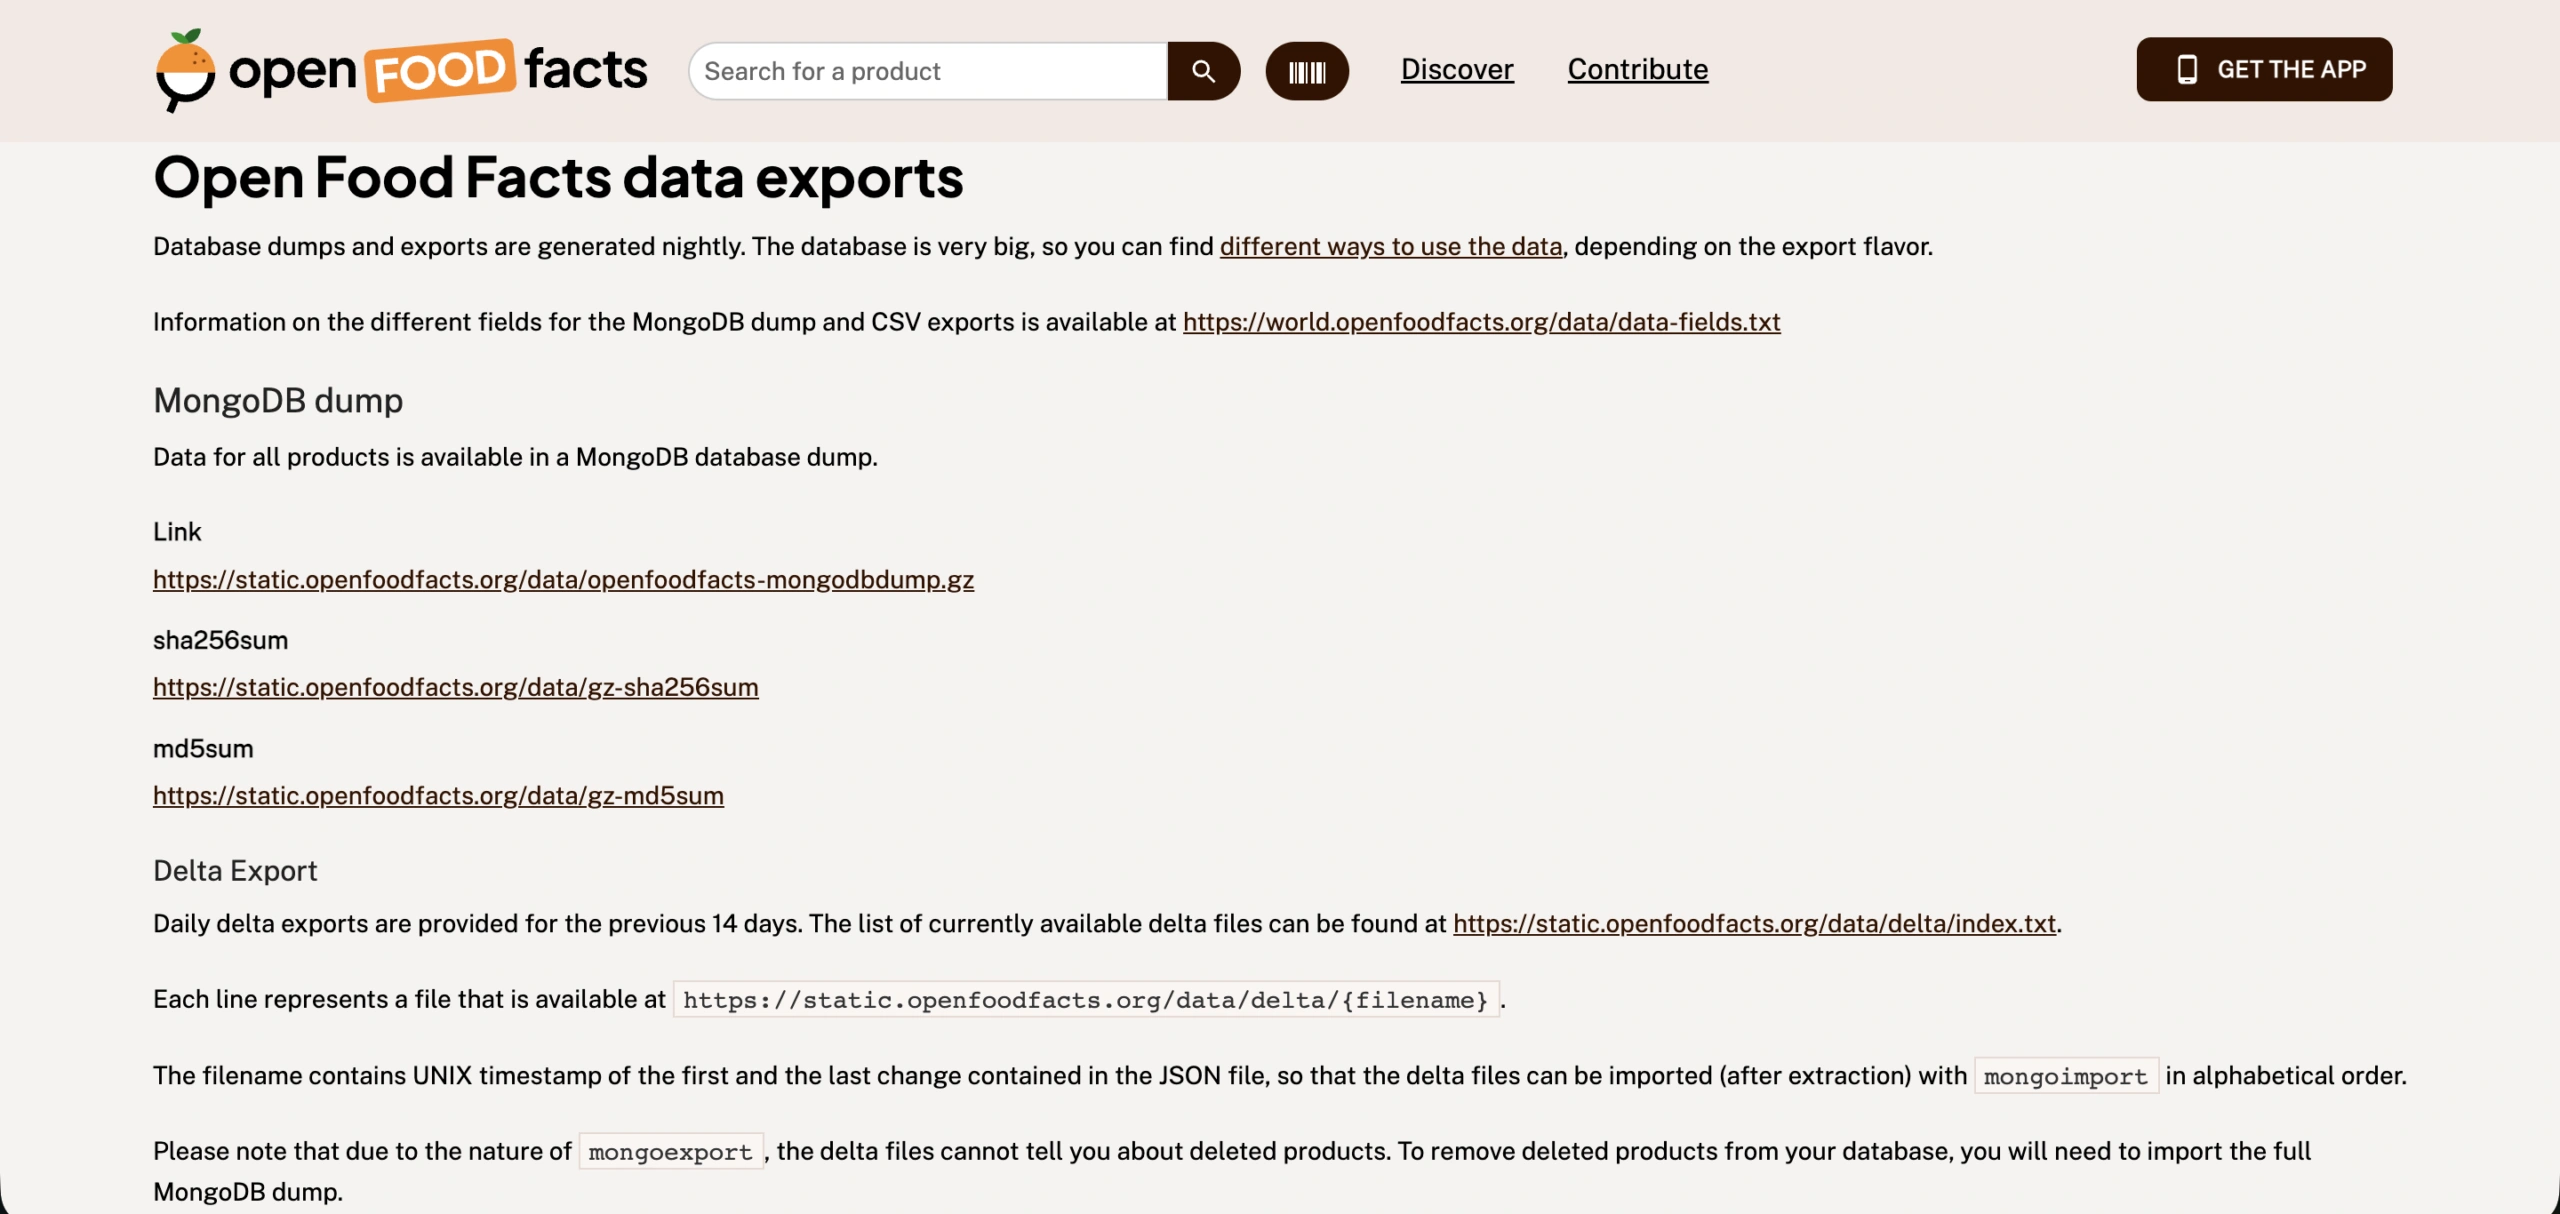
Volume: 3M+ products globally; barcodes, nutrition labels, ingredients, packaging, and category metadata
Access: Free (Open Database License — ODbL)
Format: CSV / MongoDB dump / REST API
Task Fit: Product matching, attribute extraction, catalog normalization, grocery recommendation enrichment
Open Food Facts is a community-maintained open product catalog useful for enriching grocery recommendation pipelines with nutrition, category, and packaging metadata. It is particularly valuable for catalog normalization across retailers — matching products by barcode when retailer-specific SKU schemas diverge. The main limitation is uneven completeness: some product attributes are missing for large portions of the catalog. Build quality filters and fallbacks before using it in a production matching pipeline.
Google Analytics Sample Dataset (BigQuery)
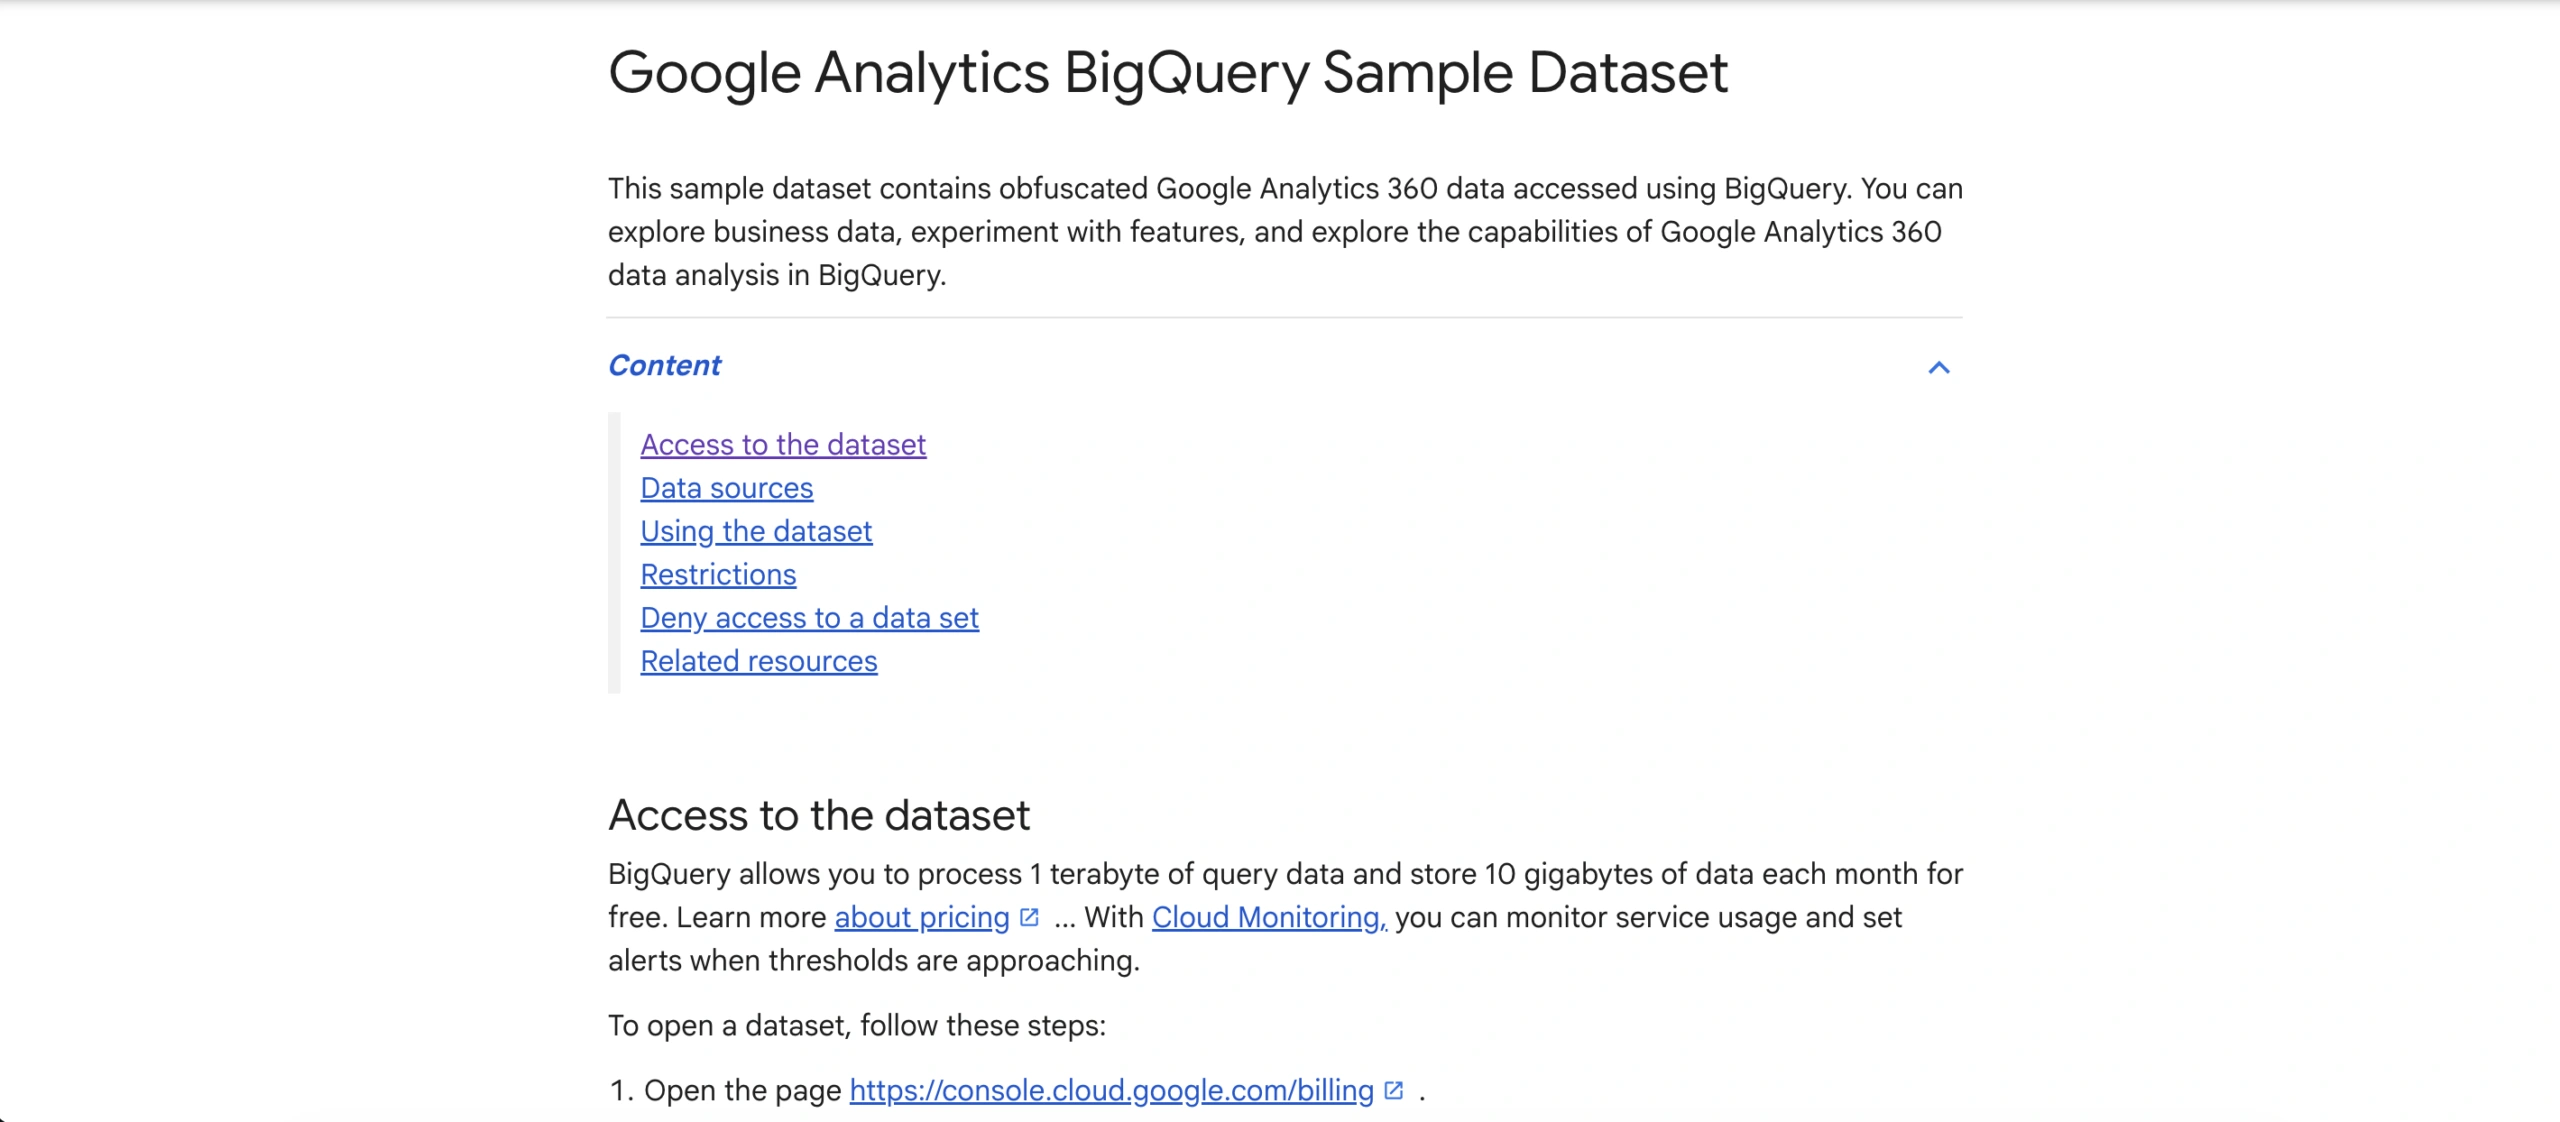
Volume: ~900K sessions; Google Merchandise Store data; available as a BigQuery public table
Access: Free (Google Cloud account and BigQuery access required)
Format: BigQuery table (nested JSON schema)
Task Fit: Web analytics ML, funnel analysis, session feature engineering, conversion prediction sandbox
The Google Analytics Sample Dataset is a sandbox for web analytics ML when you cannot use production tracking data. It models e-commerce sessions with pageview sequences, traffic source, device, and transaction outcomes. The BigQuery schema is nested and requires unnesting — plan your feature engineering around that. The dataset reflects a single Google-run store, so attribution patterns and traffic mix may not generalize to other retailers. Use it to build and test session-based feature pipelines before applying them to proprietary data.
UCI Online Shoppers Purchasing Intention
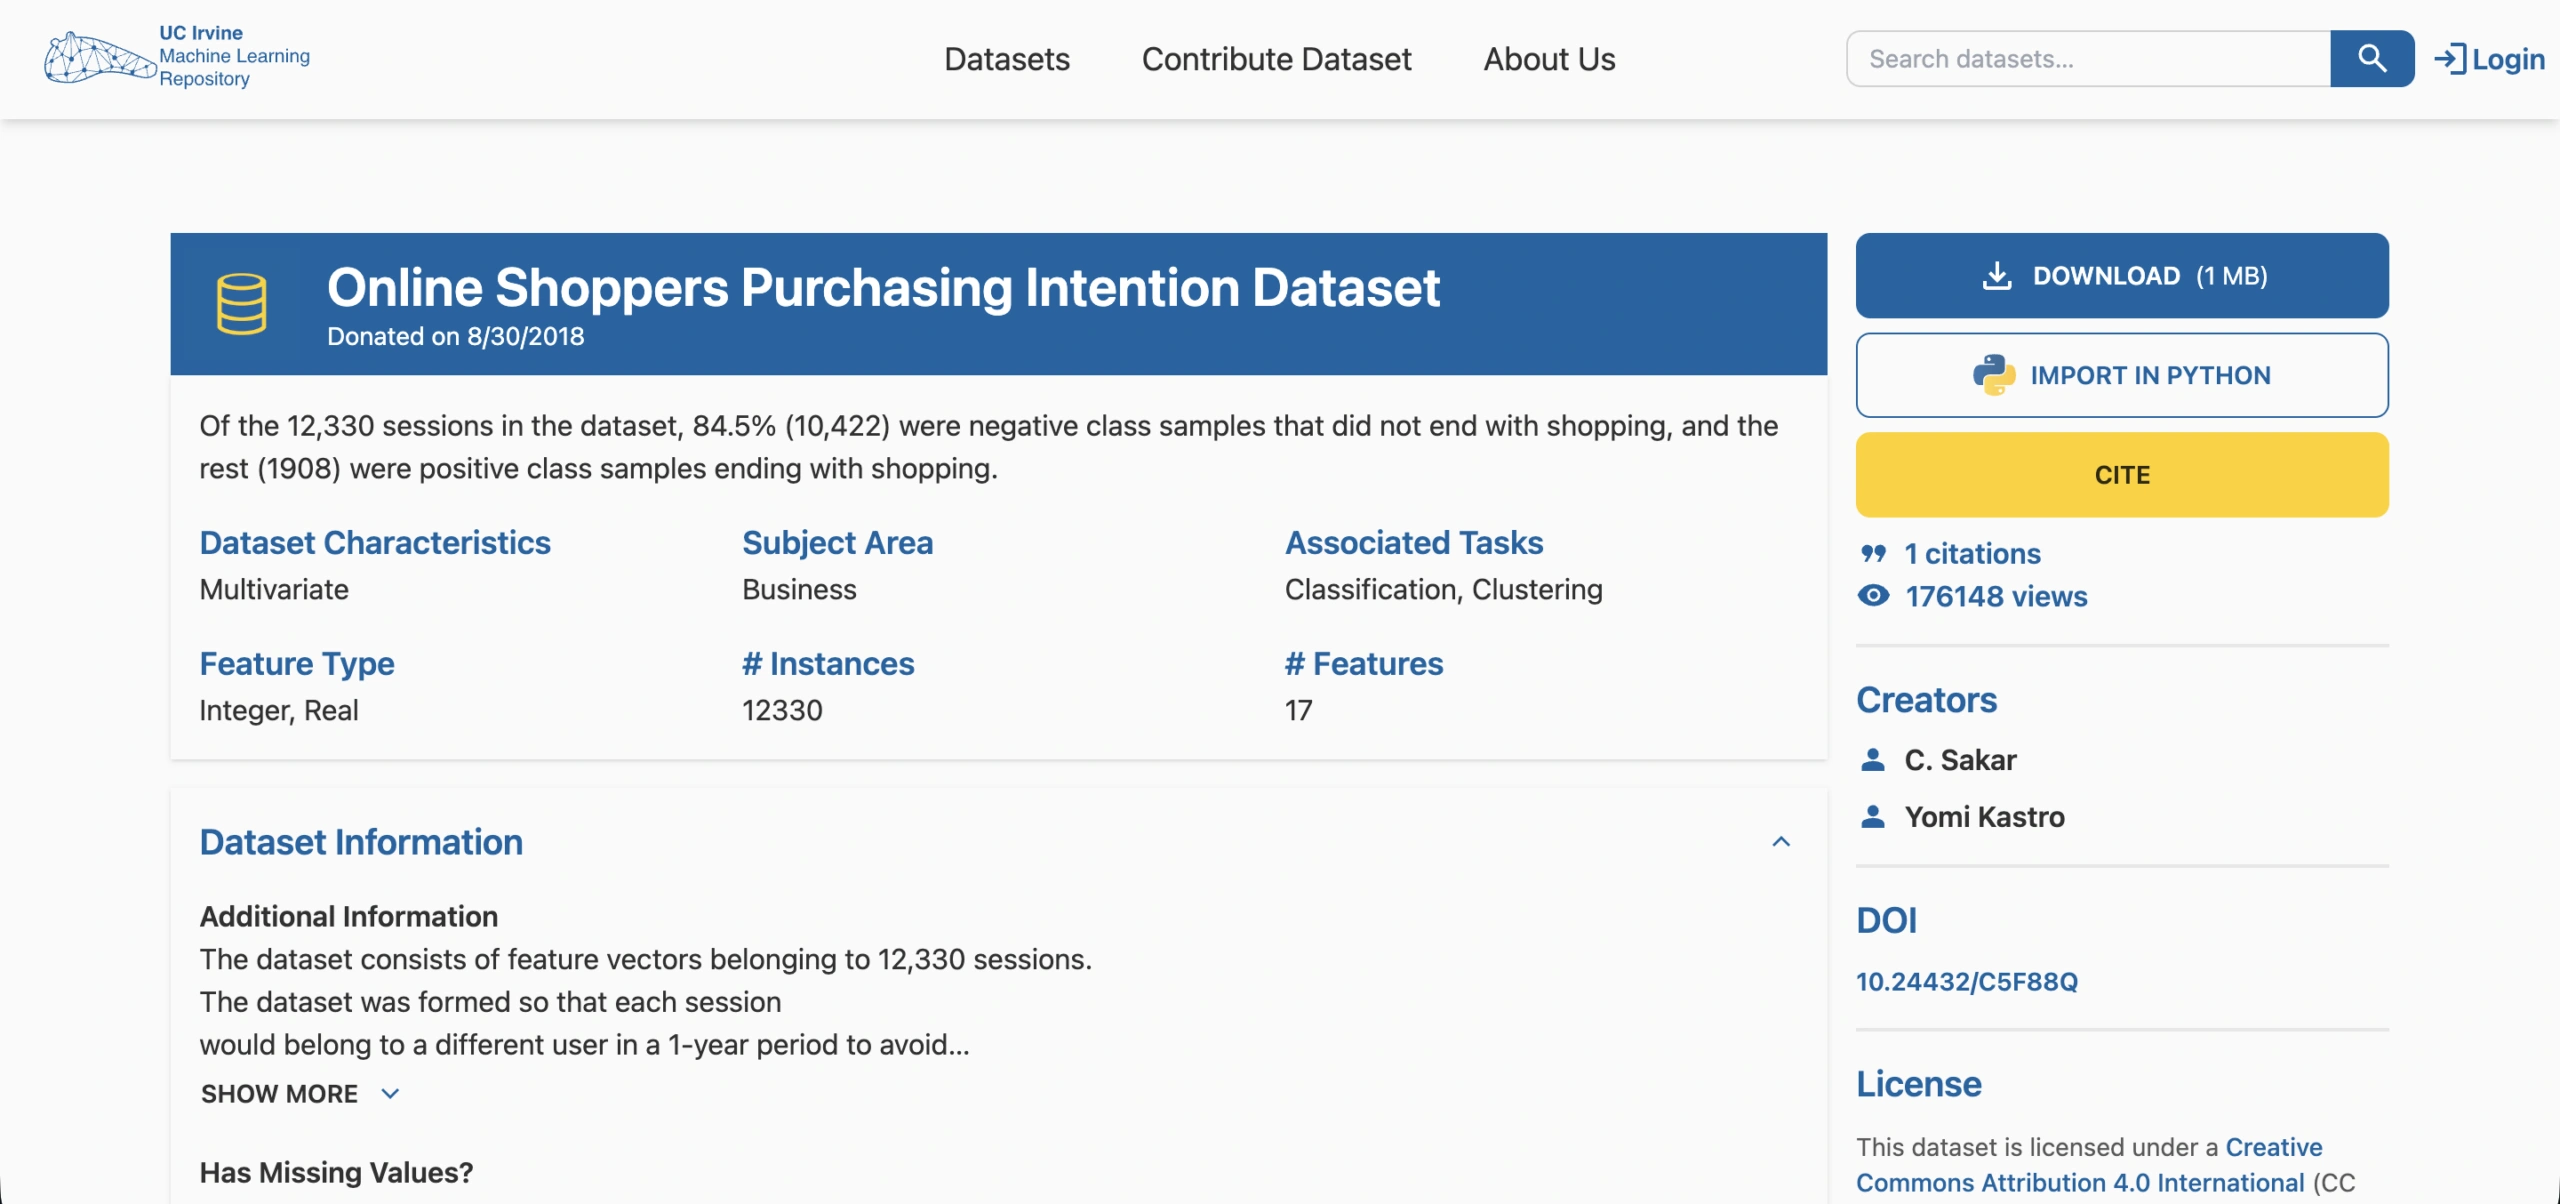
Volume: 12,330 sessions; 18 features including page views, bounce rate, exit rate, product-related duration, and revenue label
Access: Free
Format: CSV
Task Fit: Conversion prediction, session exit rate modeling, feature importance for retail funnels, class imbalance practice
This is a small but well-structured dataset for binary conversion prediction — the target is whether a session resulted in a purchase (about 15.5% positive rate, reflecting realistic class imbalance). It works for testing feature pipelines and imbalance handling strategies before scaling to larger behavioral datasets. The feature set includes web-session signals that are easily available in production logs, which makes models trained here straightforward to port. Its small size means you can overfit quickly — keep baseline models alongside any complex classifier.
Retail Computer Vision: Shelves, Checkout, and Product Images
RPC: Retail Product Checkout Dataset
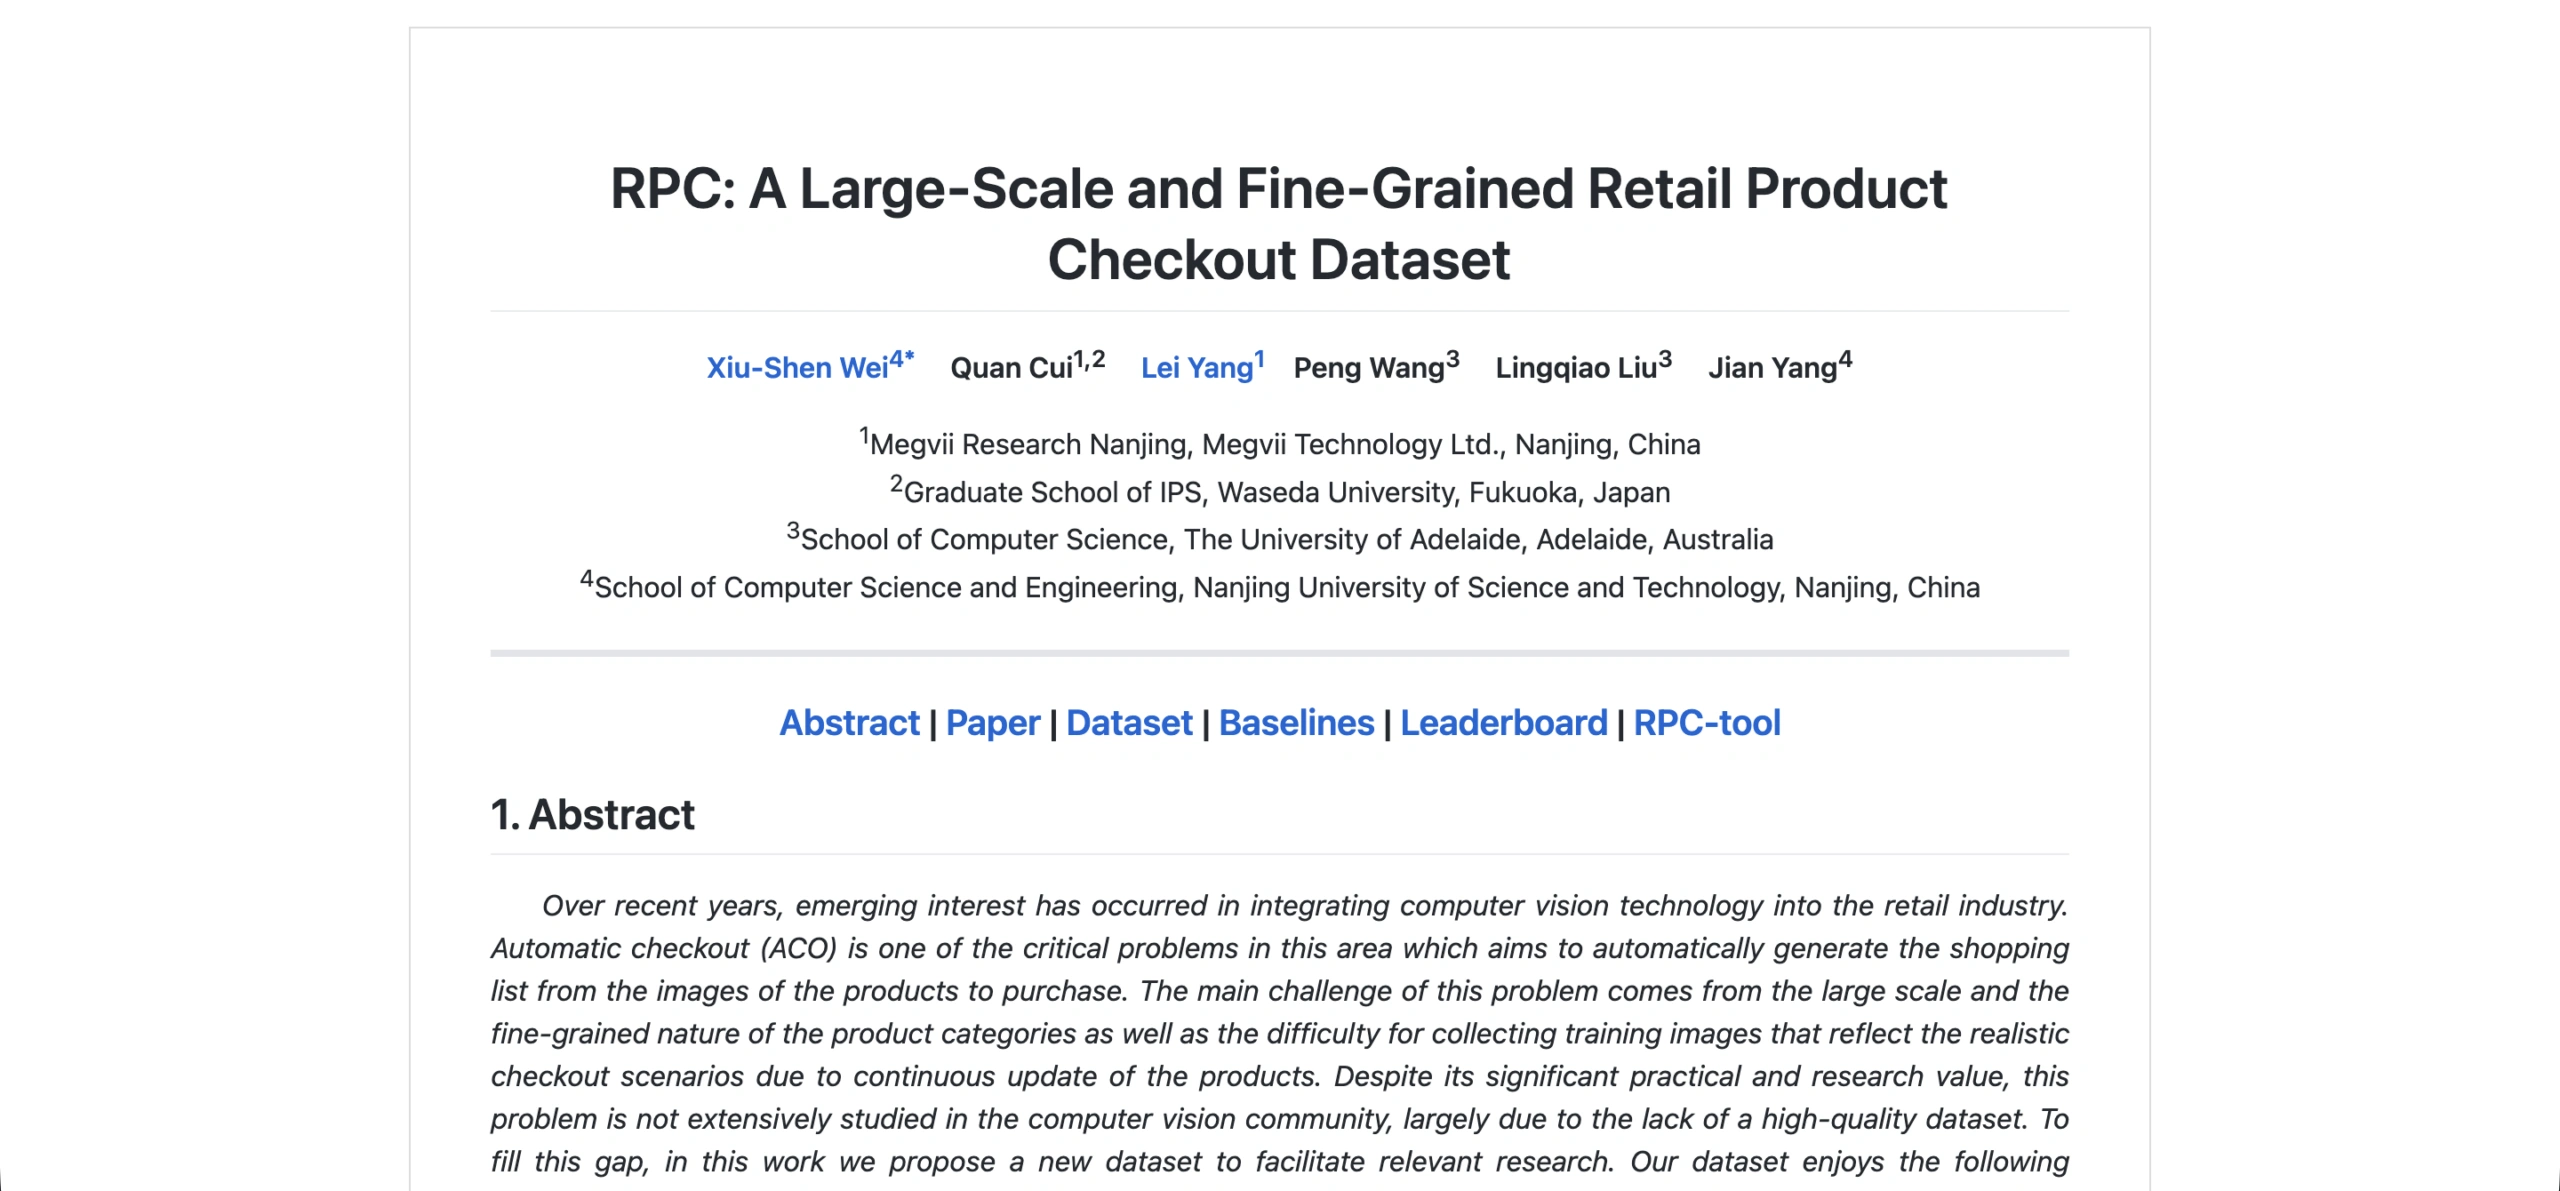
Volume: 83,739 single-product images; 24,000 checkout images with 200 product categories
Access: Free with signup
Format: JPEG + JSON annotations (COCO-compatible)
Task Fit: Automatic checkout, product recognition in cluttered scenes, instance detection, category-level recognition
RPC is built specifically for automatic checkout — the scenario where a camera at the register needs to recognize multiple products simultaneously, often with partial occlusion and lighting variation. Single-product reference images are clean; checkout images are cluttered. That domain gap is the whole story here: train on clean product images alone and you will still fail on real checkout scenes. Model clutter explicitly, or plan for a domain adaptation step between reference and deployment images.
SKU-110K
Volume: 11,762 images; ~1.7M bounding box annotations; real store shelf images with dense packing
Access: Free
Format: JPEG + CSV annotations
Task Fit: Dense object detection on shelves, planogram compliance monitoring, out-of-stock detection, shelf-level product analysis
SKU-110K is the reference dataset for dense object detection on retail shelves — many small instances per image, heavy occlusion, real store conditions with mixed lighting. It is the right dataset when your use case is shelf monitoring rather than isolated product recognition. Standard detection metrics like mAP can look acceptable while the model still misses rare SKUs on sparsely populated shelves. Track per-category recall, not just overall mAP, to catch this before deployment.
DeepFashion2
Volume: 491,895 images; 801,000 clothing instances; 13 clothing categories with keypoints, segmentation, and retrieval pairs
Access: Free with signup (academic use; application required)
Format: JPEG + JSON annotations
Task Fit: Fashion attribute detection, keypoint estimation, clothing retrieval, catalog enrichment, visual similarity
DeepFashion2 is a comprehensive fashion CV dataset with detection, keypoints, segmentation, and retrieval annotations in one package — useful for fashion search, catalog enrichment, and visual similarity tasks. The retrieval pairs (consumer-to-shop and shop-to-consumer) are particularly valuable for matching customer photos to catalog items. Fashion taxonomies drift: what mattered in the original collection period (2019) may not map cleanly to modern catalog attribute schemas. Validate category and attribute definitions against your actual catalog before using the labels directly.
When Public Retail Data Is Not Enough
Public datasets are the right starting point for baselines and proof-of-concept work. They rarely match the constraints of a production retail system:
- You need full coverage across regions and channels — not one retailer's data.
- You need consistent identifiers across stores, products, and campaigns — not anonymized keys.
- You need timely updates tied to your own product catalog — not 2019 images or 2018 transactions.
- You need permissioned use for production — not research-only licenses.
Teams that get past prototyping often discover a different gap: the data they need does not exist as a download. They need product images annotated to their own SKU schema, intent labels trained on their actual chat logs, or a pipeline that handles their specific receipt format. Those are custom annotation projects, not dataset downloads. Annotation at e-commerce scale is straightforward to scope: examples from this kind of work include 150,000 intent-labeled messages for a retail chatbot and 100,000 annotated chat messages for platform safety classification. [1] [2]
If your production requirements have outgrown public datasets, consider custom data collection as the next step — or start from a build vs. buy analysis to clarify what you actually need.
Conclusion
Retail datasets are most useful when they reproduce real retail constraints: time, promos, stock, and messy customer behavior. Start with one dataset that matches your main task, then test your pipeline on a second dataset with different characteristics. If your approach survives that, it is closer to being production-ready.
Frequently Asked Questions (FAQ)
A retail dataset is any structured data that captures shopping behavior or retail operations. The most common forms are transaction logs (orders and line items), clickstream sessions (views, carts, and purchases), product catalogs (SKU metadata and images), and retail images (shelf photos, checkout scenes, product pictures). The right dataset depends on your task: forecasting needs clean time series with promotional context, recommendations need interaction histories, and retail CV needs labeled images tied to real store conditions.
M5 Forecasting is the standard starting point — it covers item, department, store, and state levels with promotional context and a large community of published baselines. Validate your pipeline on a second dataset like Rossmann or Favorita to check whether your feature assumptions generalize. Your choice should depend on whether you need SKU-level signals, store metadata, calendar effects, and promo context — not just a large row count.
For session-based recommenders, YOOCHOOSE (RecSys 2015) and RetailRocket are common starting points. For next-basket prediction and reorder modeling, Instacart includes repeat purchase patterns and product taxonomy. H&M adds full product content — images and text — for multimodal recommendation research. Amazon Review Data from UCSD is the right choice when you need review text as a content signal alongside user histories.
Use a strict time cutoff: compute all aggregates on the training window only, and treat promotions, returns, and inventory as time-dependent facts. If a field was not known at prediction time, it cannot be a feature. In retail, leakage is often subtle: a “final price” field may already reflect future discounts, returns may be recorded after the forecast horizon, and inventory snapshots may show future stockout resolutions. Build leakage checks into your feature validation pipeline, not as an afterthought.
Yes, and access varies by task. RPC (Retail Product Checkout) covers automatic checkout with 83K single-product and 24K checkout scene images — free with signup. SKU-110K covers dense object detection on shelves — 11.7K images, 1.7M bounding boxes, free on GitHub. DeepFashion2 covers fashion detection, keypoints, and retrieval — 491K images, free with an academic application. All three target different hardware setups and label schemas, so match the dataset to the specific scenario your model will face in deployment.