Machine Learning (ML) has revolutionized how we analyze data, build models to predict the future, and even automate routine decision-making processes. Whenever you unlock your phone with facial recognition, receive product recommendations online, or watch your credit card transactions being instantly verified, machine learning is hard at work behind the scenes. Yet, one of the most fascinating subfields—often overshadowed by predictive modeling—goes by the name Unsupervised Learning.
So, buckle up: from dimensionality reduction to clustering, unsupervised learning is like a detective searching for clues in the data. The best part? It doesn’t need explicit instructions on which clues matter most.
1. What Is Unsupervised Learning?
Unsupervised learning is a branch of machine learning that deals with unlabeled data. If you’ve heard about supervised learning, you might know that in those scenarios, your data has clear labels (like “spam” vs. “not spam”). In contrast, unsupervised learning receives no direct guidance. It’s the difference between “Here’s a labeled example—learn from it!” and “Here’s some data—figure out the interesting patterns yourself.”
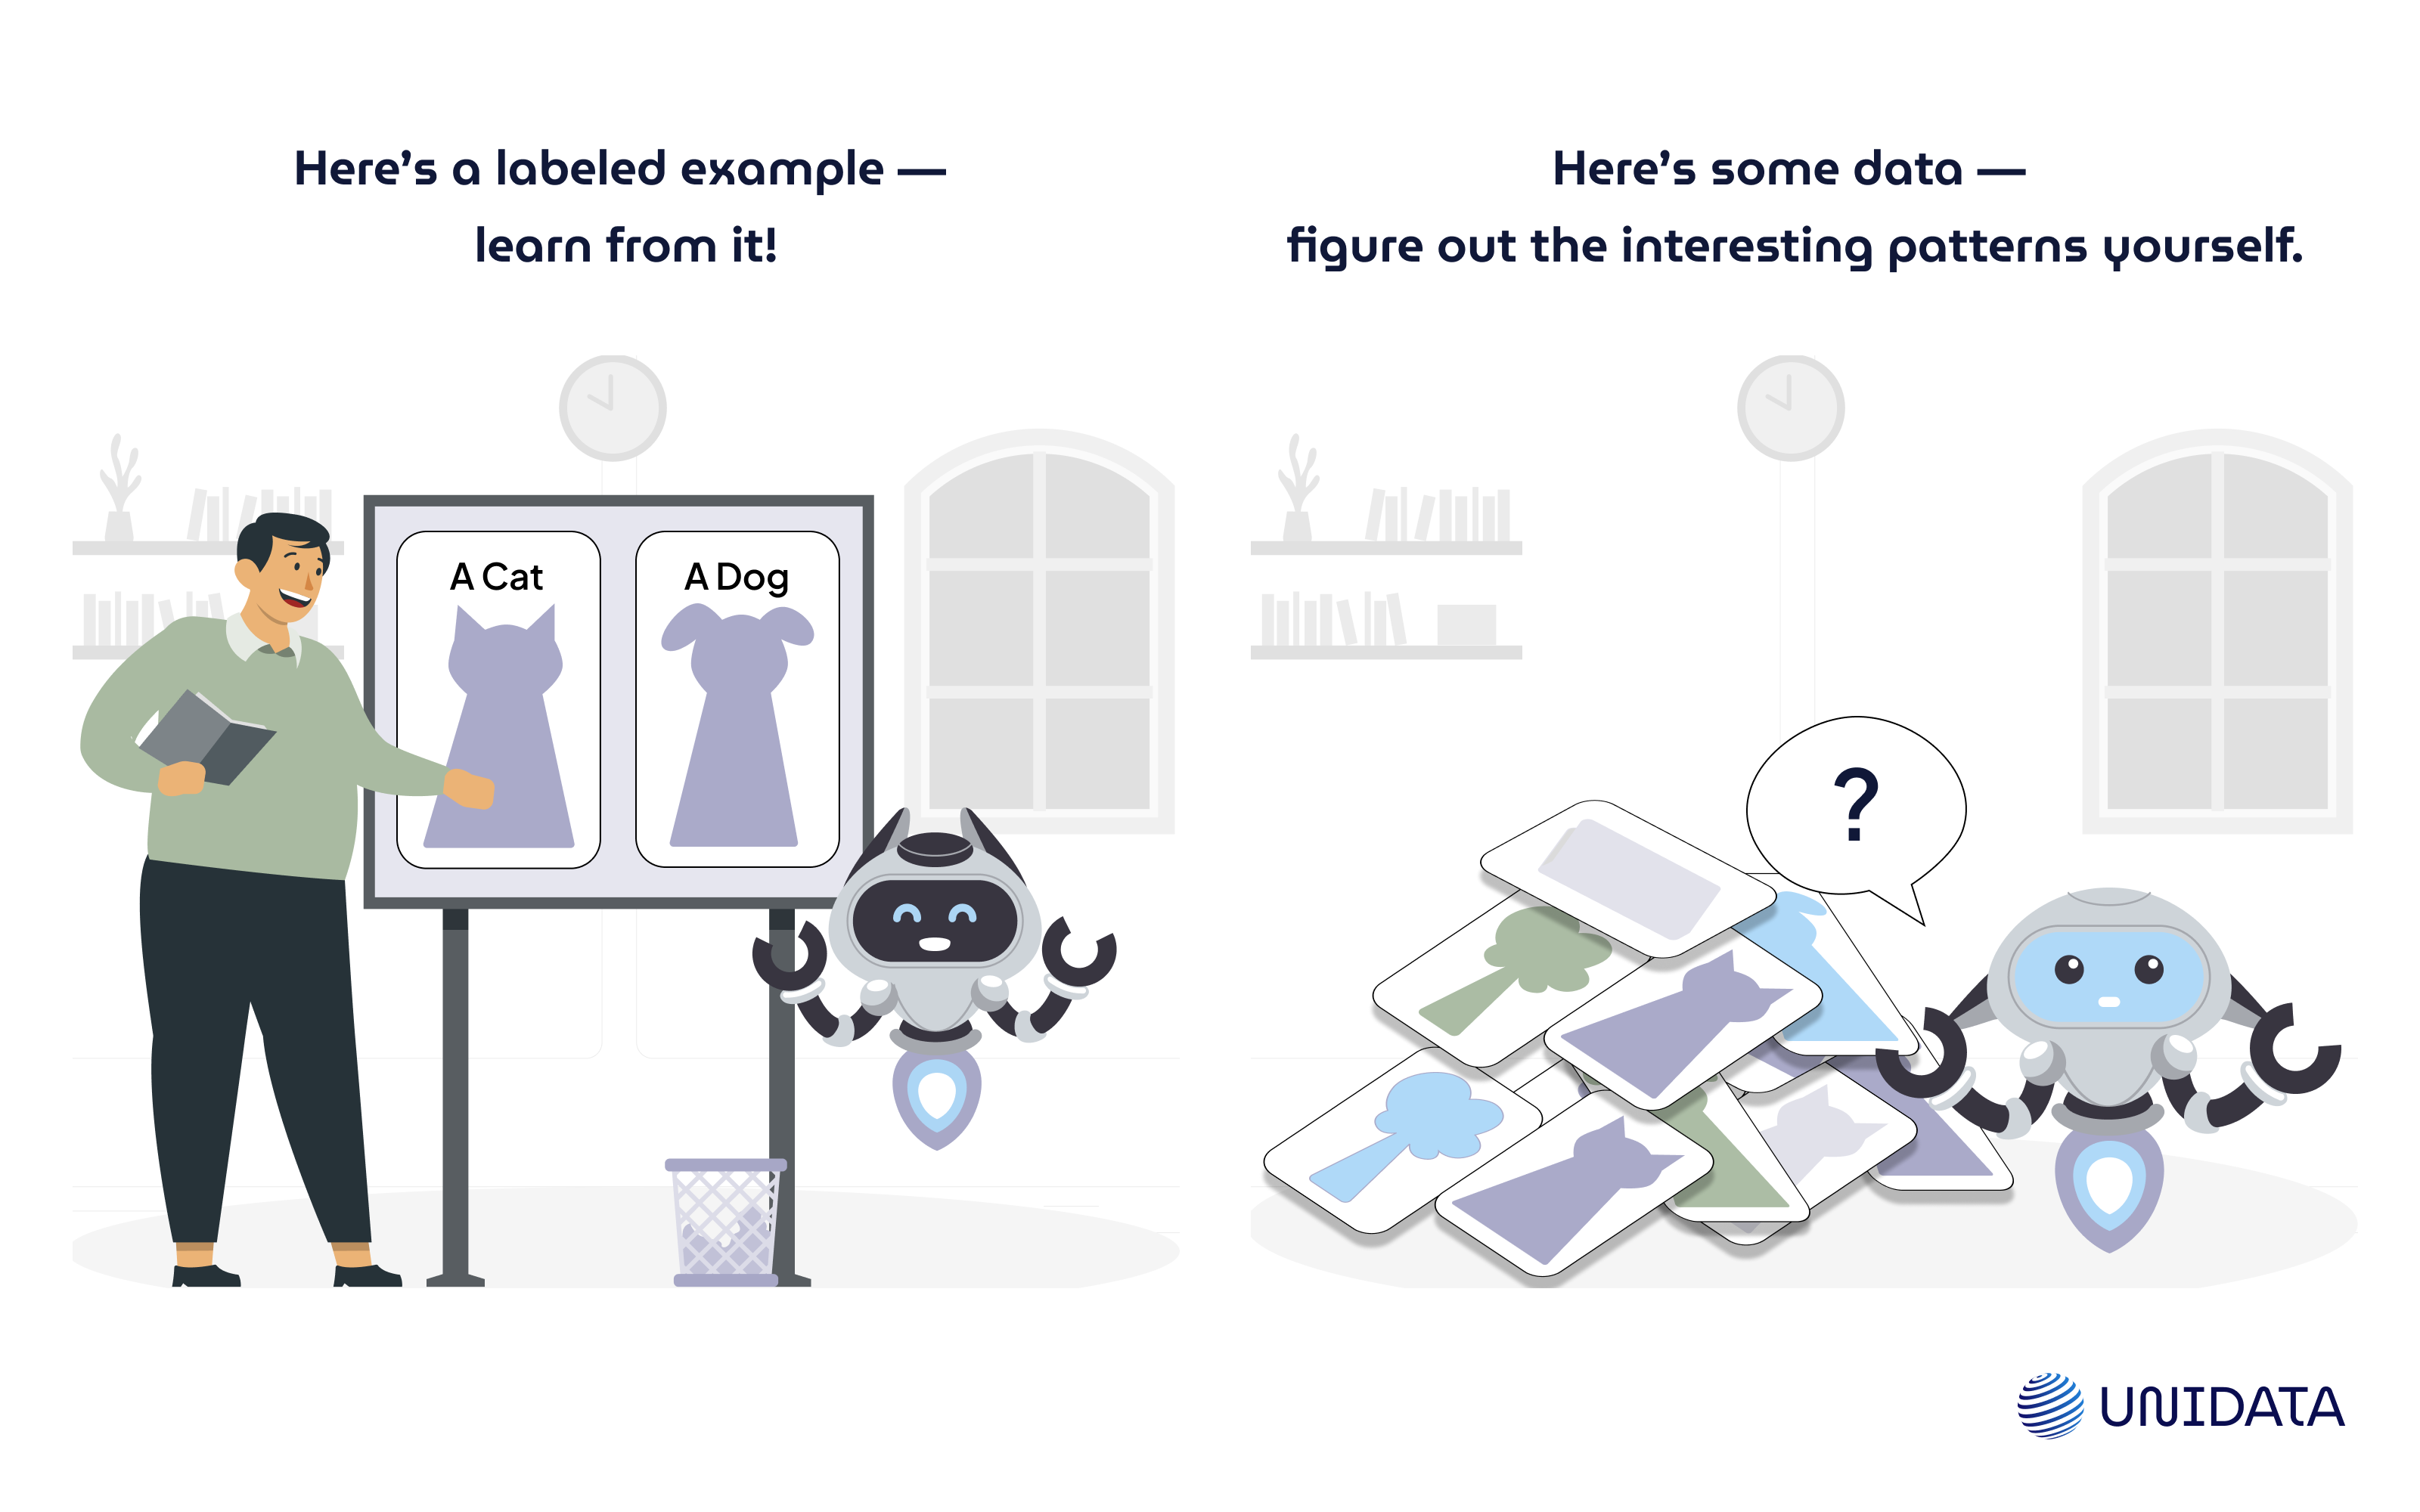
- Self-Discovery of Patterns
Think of it like exploring a new city without a guide. You observe the streets, architecture, and landmarks to group neighborhoods and discover hidden gems. Similarly, unsupervised algorithms explore the data to find structures, be they groups of similar items or underlying relationships that might not be obvious at first glance. - No Right or Wrong Labels
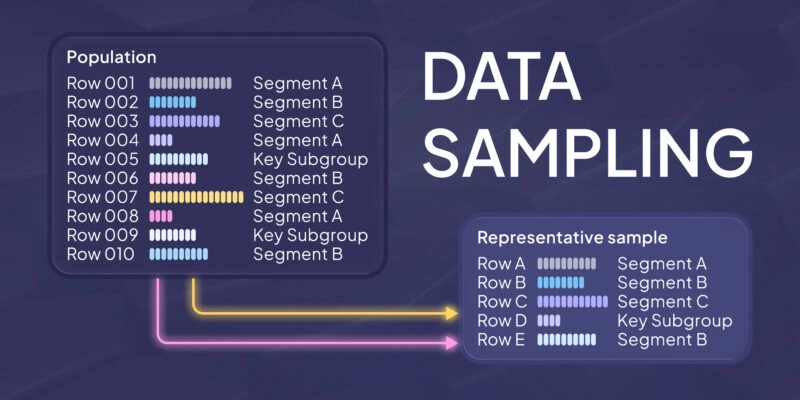
Because we don’t have labeled data telling us what each example “should” be, we have to rely on internal metrics or domain knowledge to judge if the discovered structure is useful. For example, if a clustering algorithm separates your customers into different segments, you might realize that each segment has distinct purchasing behaviors. That realization can be extremely helpful, even if there was no predefined correct “segment” label. - Broad Range of Techniques
Unsupervised learning includes clustering (e.g., K-means, DBSCAN, Hierarchical Clustering), dimensionality reduction (e.g., PCA, t-SNE, Autoencoders), density estimation, and more. Each technique serves different goals, but they all share the same principle: “No labels? No problem!”
For example, imagine candy sorting:
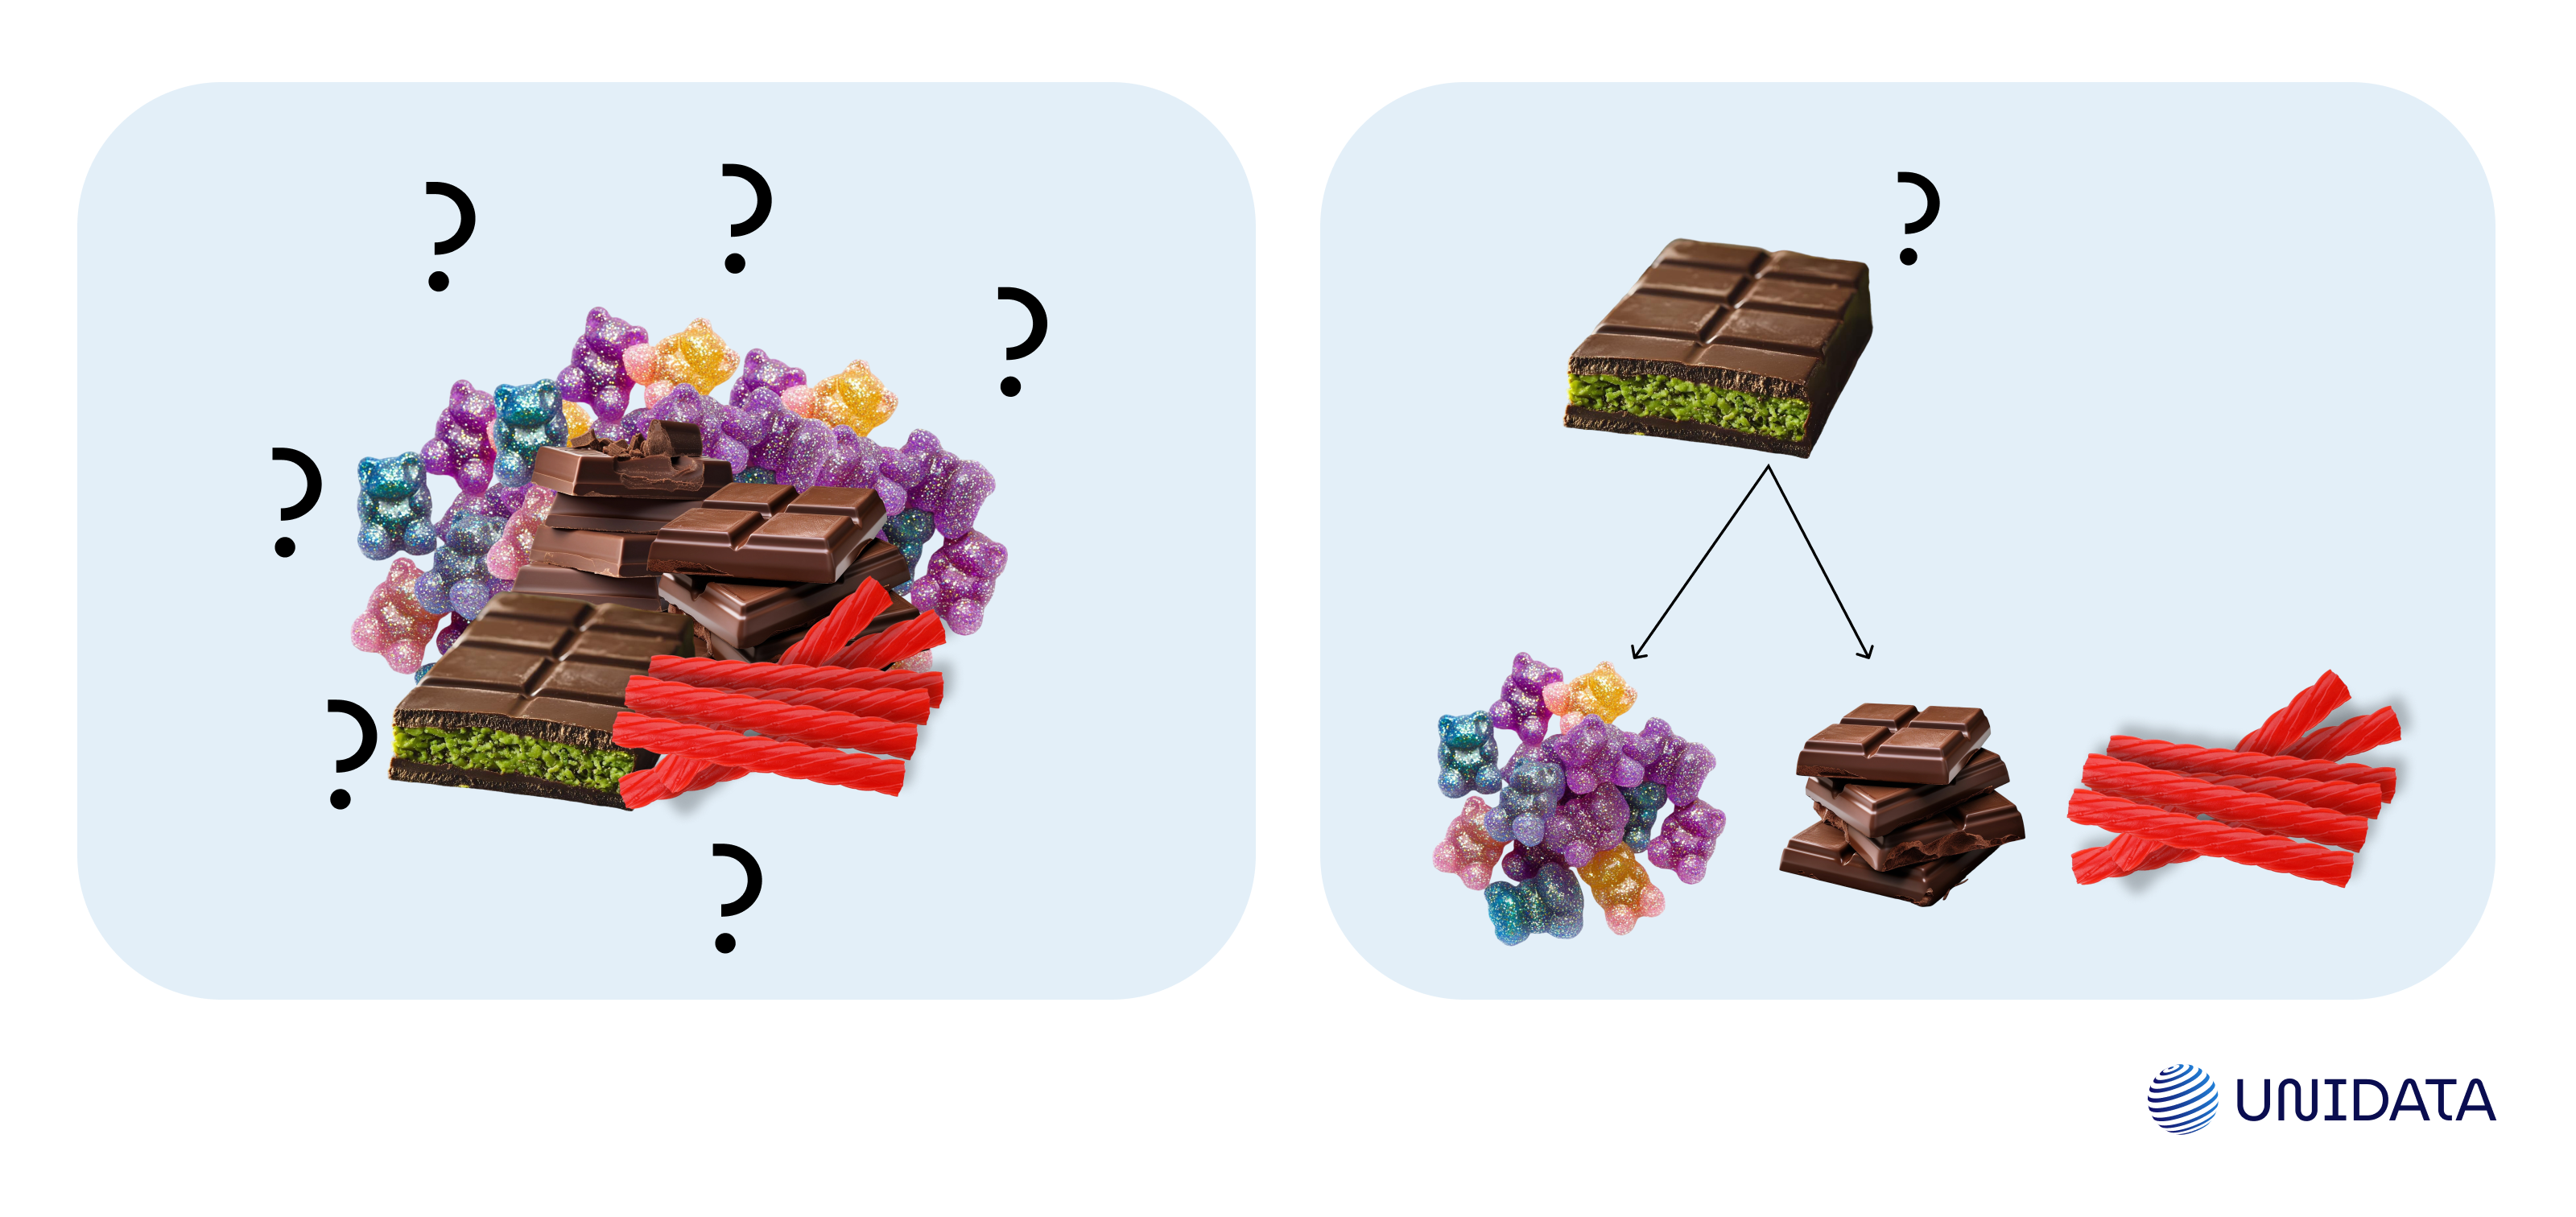
- You have a mix of chocolates, gummies, and licorice—none are labeled.
- You notice color, texture, and shape, and naturally group the darker chocolates in one cluster, fruity gummies in another, and the long licorice sticks separately.
- Some borderline candies (chocolates with fruit fillings) might cause confusion, reflecting how real data points might sit between clusters.
- You end up with categories you didn’t explicitly know from the start—just like an unsupervised algorithm.
2. How Does Unsupervised Learning Work?
To understand this process, let’s break it down:
- Data Collection & Preprocessing
- In unsupervised learning, you often start with raw data (say, a big CSV file or a massive database).
- Preprocessing is crucial: you may need to handle missing values, remove duplicates, or standardize numerical features (e.g., scaling each feature to a common range).
- Because there are no labels to guide you, careful feature selection or feature engineering is invaluable to highlight what you think might be relevant.
- Discovery of Structure
- An algorithm, such as K-means, iteratively groups data points that are similar (based on distance metrics) into clusters.
- Alternatively, a dimensionality reduction algorithm like Principal Component Analysis (PCA) can compress many features into fewer “principal components” without losing much information.
- The general idea is that the data itself guides the creation of internal patterns or relationships.
- Evaluation
- Unlike supervised learning, you can’t simply compare predictions to known labels and calculate accuracy or F1-score.
- Instead, you might use metrics like the Silhouette score (for clustering) or reconstruction error (for autoencoders) to see if the algorithm is capturing coherent structure.
- Domain knowledge is often the ultimate judge—sometimes a pattern is only useful if it can be interpreted and acted upon in a real-world context.
- Iterative Improvement
- Just like language evolves with new slang, your data might evolve over time. Periodically retraining or fine-tuning unsupervised models is wise.
- You can also experiment with different numbers of clusters (in K-means) or different dimensionality-reduction methods to find what best reveals actionable insights.

Picture a library full of unsorted books. Unsupervised algorithms help you find common themes—romance, mystery, sci-fi—so you can place them together on the right shelves, even if you didn’t know each book’s genre beforehand.
Practical Tips for Implementation
- Feature Scaling:
Many distance-based methods (like K-means) are sensitive to feature magnitudes. Consider using StandardScaler or MinMaxScaler. - Choosing the Number of Clusters:
- The Elbow Method helps you observe within-cluster sum of squares (WCSS) across different 𝜿 values.
- Silhouette Score quantifies how well each point fits within its cluster vs. other clusters.
- Gap Statistic (Tibshirani et al.) compares your data’s clustering with that of a reference null distribution.
- Large Datasets:
If your data is huge, algorithms like MiniBatchKMeans can process it in smaller chunks and still deliver good results. - Dimensionality Reduction Before Clustering:
For high-dimensional data, PCA or autoencoders can significantly reduce computation time while often improving cluster separations. - Dimensionality Reduction Before Clustering:
For high-dimensional data, PCA or autoencoders can significantly reduce computation time while often improving cluster separations.
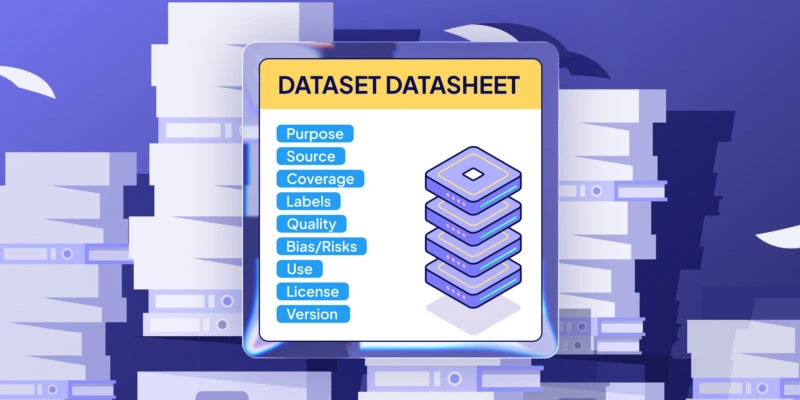
What Is a Dataset in Machine Learning?
Learn more
3. Unsupervised Learning Approaches
3.1 Dimensionality Reduction
- Principal Component Analysis (PCA)
PCA identifies directions (principal components) that explain the most variance in the data. It’s a staple for visualization—reducing hundreds of dimensions to just two or three, so you can plot data points and visually identify patterns.
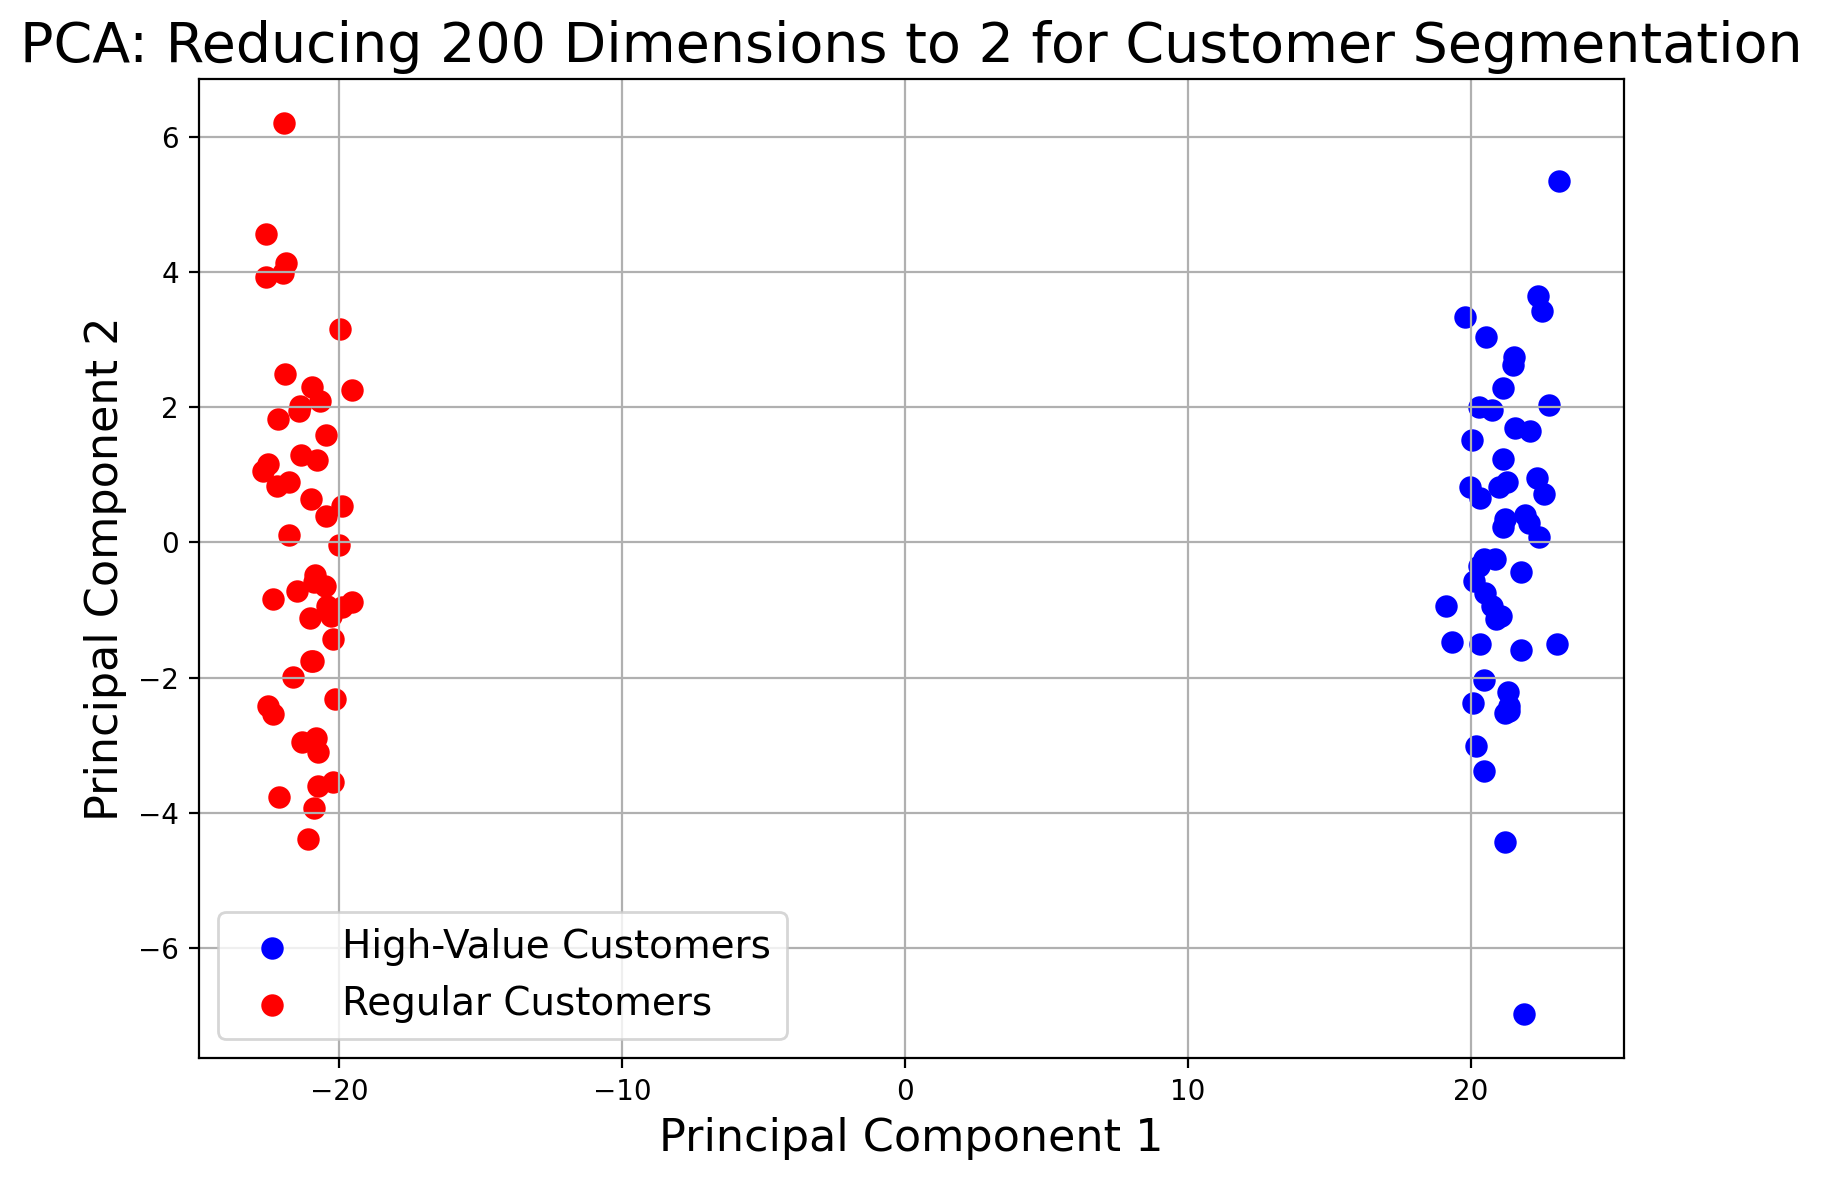
Imagine you have hundreds of measurements capturing various aspects of customer behavior on a website. PCA compresses these 200 features into just 2 main components, revealing clusters (in this case, two groups of customers) that can be easily visualized.
- t-SNE and UMAP Both t-SNE and UMAP help uncover patterns in high-dimensional, unlabeled data by projecting it into two or three dimensions. Because unsupervised learning doesn’t rely on labels, these methods focus on preserving distances or “local neighborhoods” in the data.
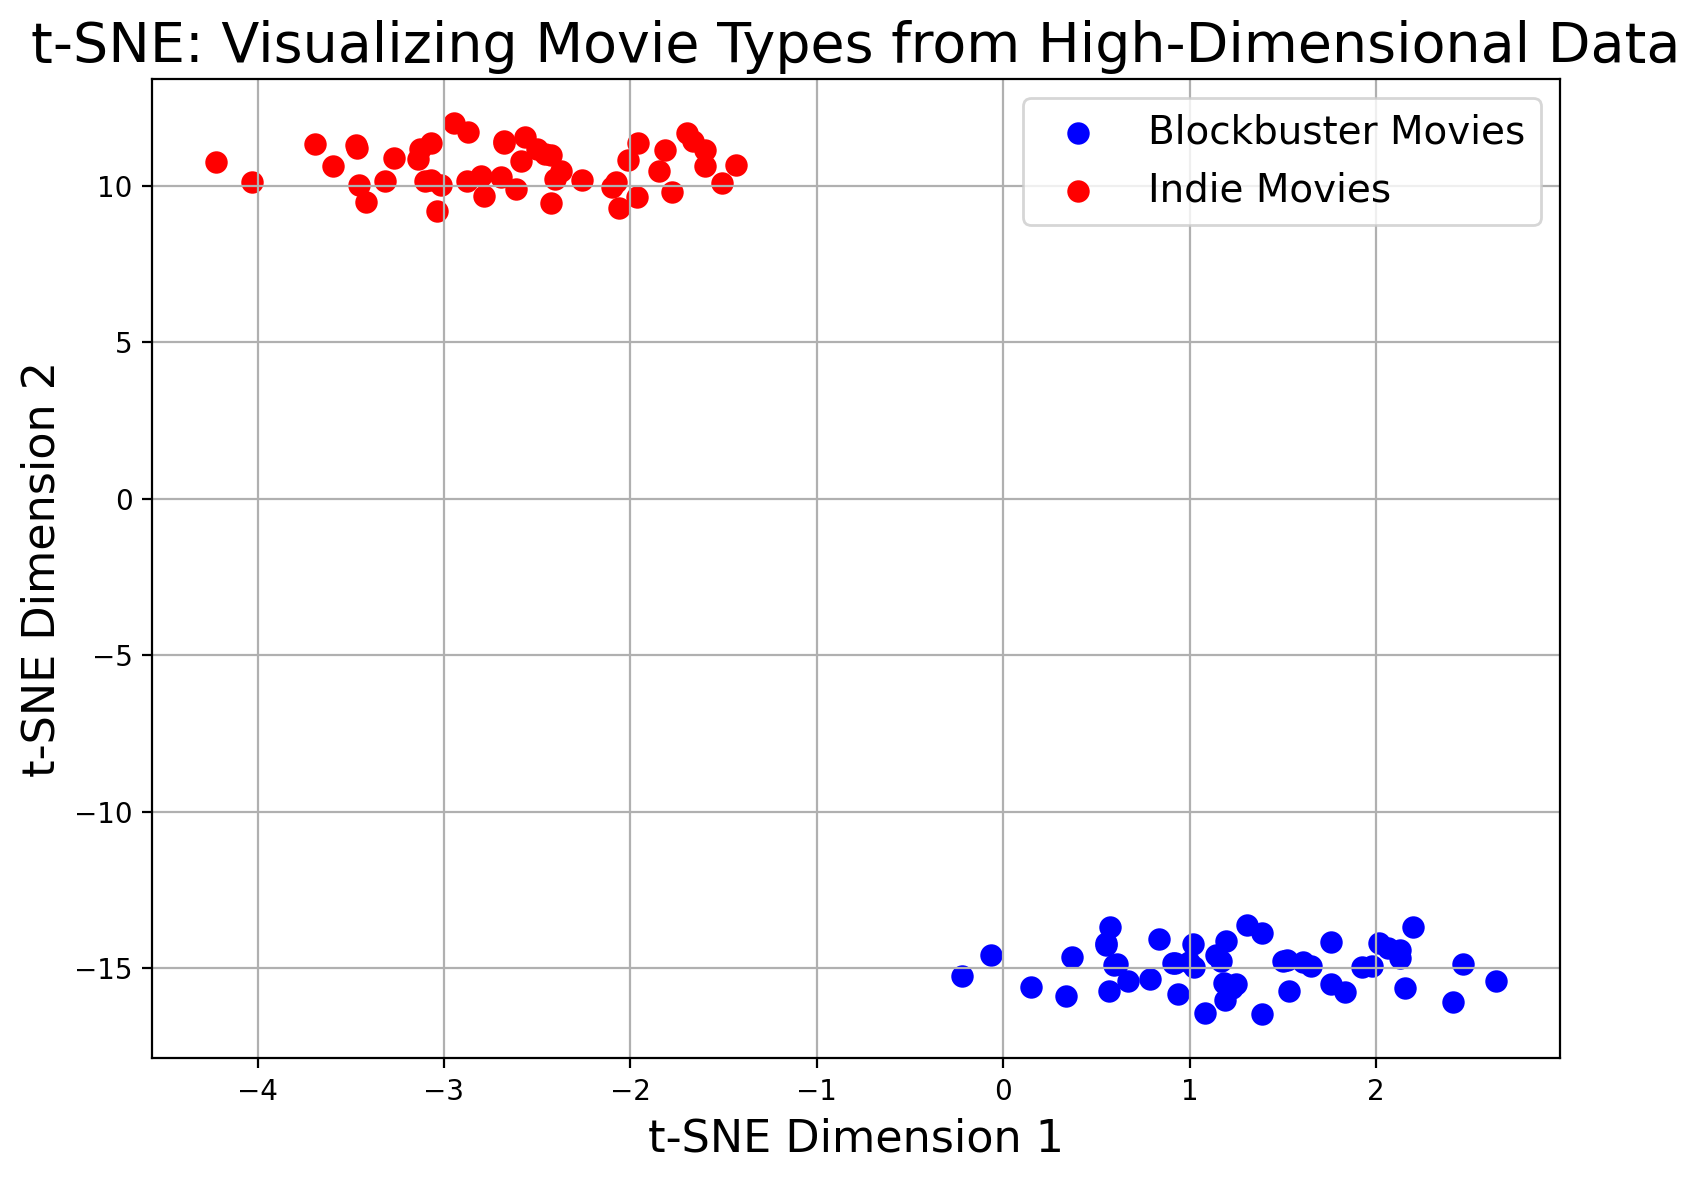
Imagine you have 100 movies described by 200 detailed features. The blockbuster movies (blue points) have higher overall feature values—perhaps indicating big budgets and high production values—while the indie movies (red points) have baseline values. t-SNE reduces these 200 features into a 2D space so you can easily see two clusters corresponding to these movie types.
- Autoencoders (Neural Network Approach)
An autoencoder is trained to compress data into a lower-dimensional code and then reconstruct the original input. The lower-dimensional “latent space” can reveal underlying patterns in complex data, often used in anomaly detection.
For example: you track your daily health using a wearable device that records 200 different sensor measurements. Active days (blue points) have higher overall sensor readings, while sedentary days (red points) stay closer to the baseline. The autoencoder compresses these 200 measurements into a 2D latent space, clearly separating the two types of days and revealing underlying patterns in your health data.
These approaches can be combined or layered. For instance, you might reduce dimensionality with PCA before clustering, speeding up calculations and helping the algorithm find more robust groupings.
3.2 Clustering
- K-means Clustering
Perhaps the most famous clustering algorithm, K-means aims to partition data into 𝜿 clusters in which each data point belongs to the cluster with the nearest mean. It’s relatively simple, fast, and works well if you have a sense of how many clusters you need.
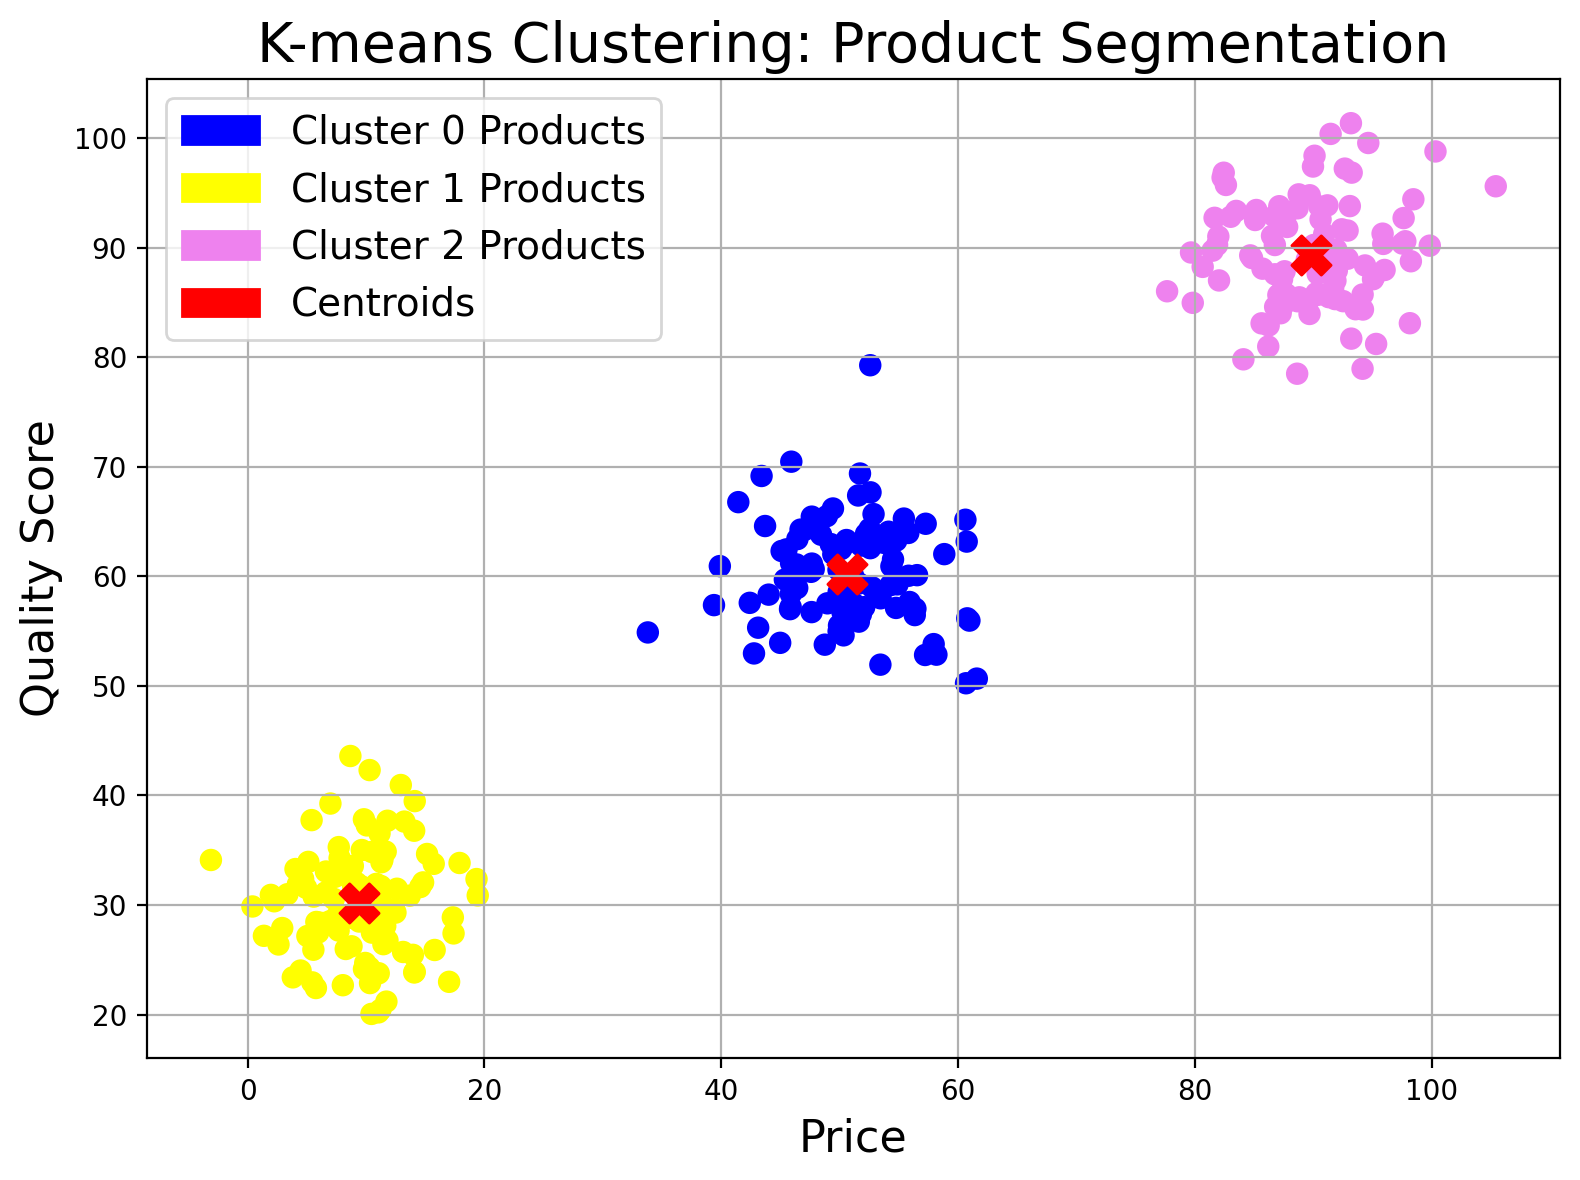
In this example, each product is described by its price and quality score. K-means clustering groups the products into three clusters—displayed as blue, yellow, and violet dots (Cluster 0, Cluster 1, and Cluster 2, respectively). The red X's indicate the centroids (average values) for each cluster, helping to define distinct product categories like budget, mid-range, and premium.
- DBSCAN (Density-Based Spatial Clustering of Applications with Noise)
DBSCAN clusters points that are closely packed together while marking outliers (points in low-density regions) as anomalies. It’s particularly helpful when clusters have irregular shapes or you want to detect anomalies.
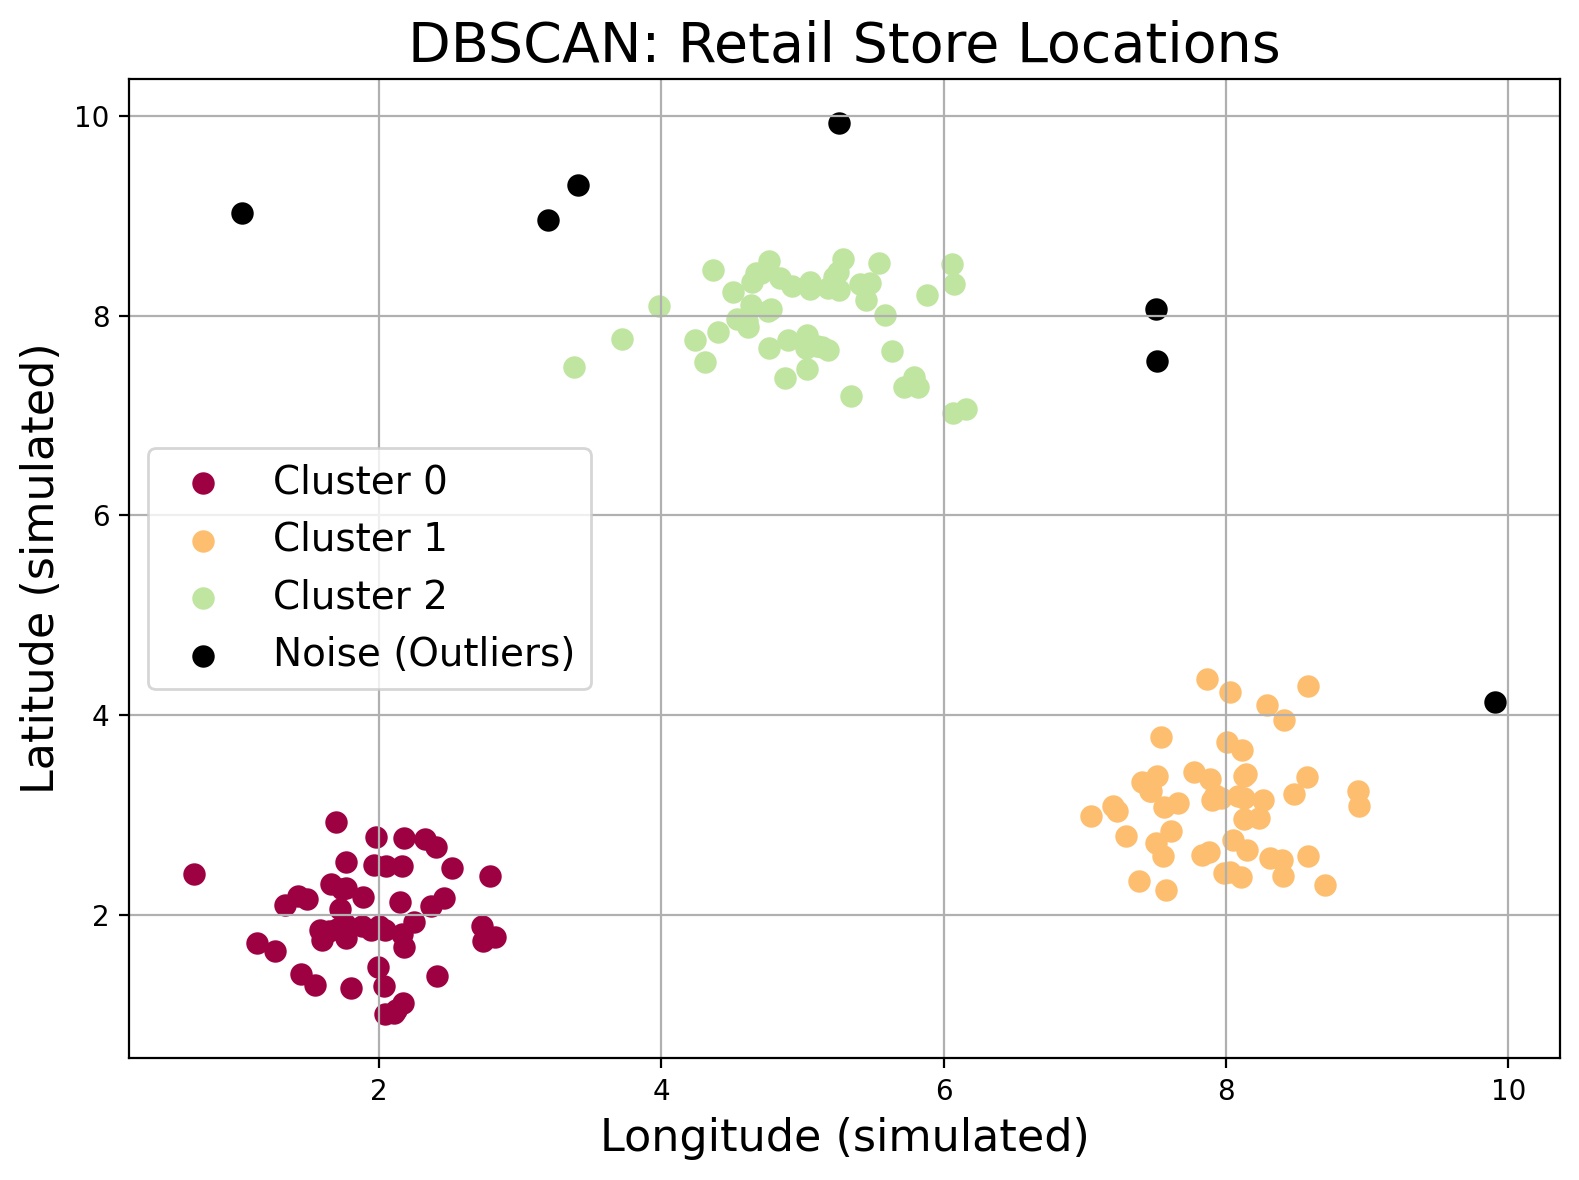
Imagine you’re studying the locations of retail stores in a city. DBSCAN clusters stores that are tightly packed (like in busy shopping districts) and flags isolated ones as outliers, helping you identify both hotspots and anomalies.
- Hierarchical Clustering
This method builds a tree (or dendrogram) of clusters. You can cut the tree at any level to get a chosen number of clusters. It’s very interpretable—often used in gene expression data in biology to see how genes cluster together by similarity.
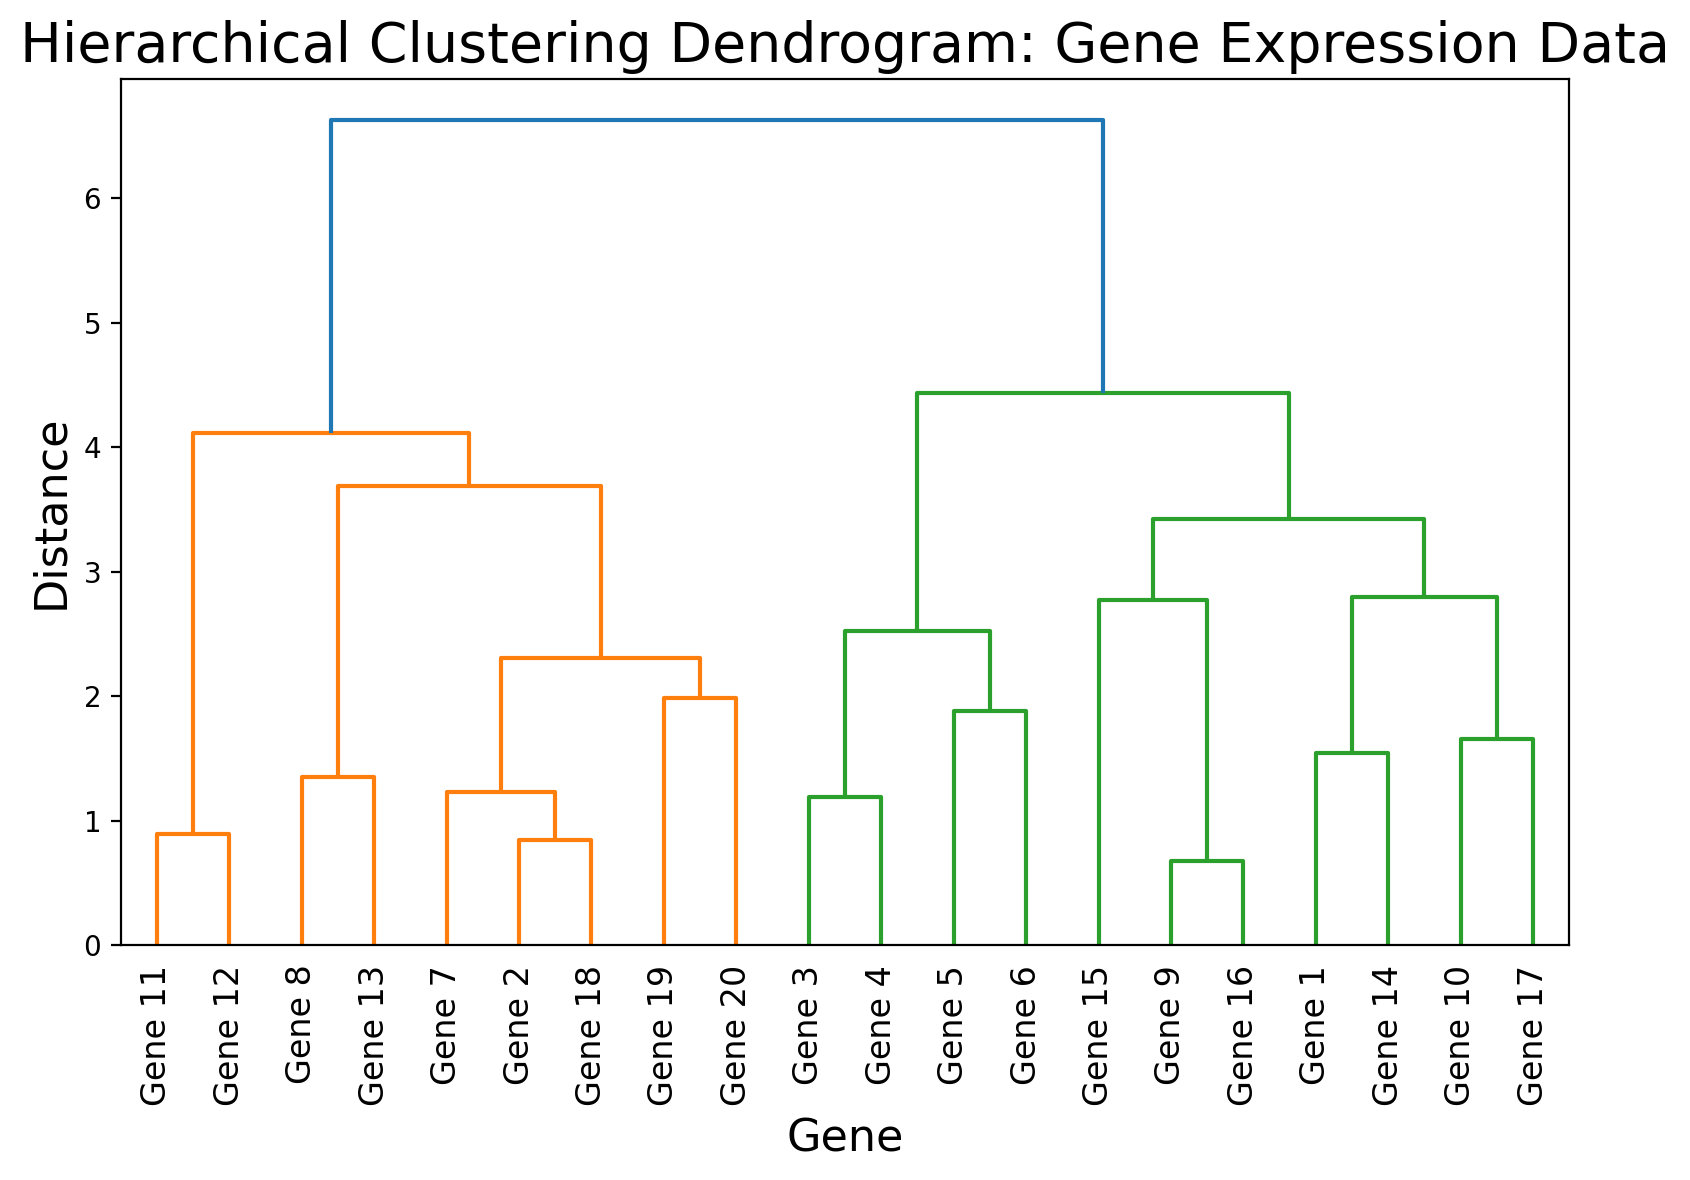
You’re analyzing gene expression data to see how similar different genes are. Hierarchical clustering organizes genes into a tree structure (dendrogram), allowing you to visually “cut” the tree to form clusters of functionally related genes.
Case Study:
Customer Segmentation in Marketing: An e-commerce site uses clustering on purchase history, browsing patterns, and demographics to find distinct customer segments. Then they tailor marketing campaigns to each segment—perhaps launching specialized discount codes for “casual browsers” or exclusive membership deals for “frequent spenders.” (Marketing Segmentation Case Study by Deloitte).
Mathematical Formulations
- K-means Objective:
The algorithm iteratively minimizes the within-cluster sum of squares (WCSS):
$$$ \text{WCSS} = \sum_{i=1}^{k} \sum_{\mathbf{x} \in C_i} \|\mathbf{x} - \boldsymbol{\mu}_i\|^2 $$$where $$\boldsymbol{\mu}_i$$ is the centroid of cluster $$\mathbf{C}_i$$
- PCA: PCA discovers principal components by performing eigen-decomposition on the data covariance matrix.
where each $$\mathbf{V}_i$$ is a principal direction capturing variance $$\mathbf{\lambda}_i$$
References:
- Elements of Statistical Learning, Hastie, Tibshirani, Friedman (Springer, 2009)
- Pattern Recognition and Machine Learning, Bishop (Springer, 2006)
3.3 Advanced Methods
There are some emerging trends in Unsupervised Learning:
Self-Supervised Learning: Bridges the gap between unsupervised and supervised by creating “pseudo-labels” from the data itself (e.g., SimCLR for images).
Imagine you’re working on a jigsaw puzzle, but a few pieces are missing. Instead of giving up, you start inferring the missing parts based on the surrounding pieces. That’s exactly what self-supervised learning does. Techniques like SimCLR take an image, apply random tweaks (think of them as different puzzle pieces), and then teach the system that these altered versions still belong to the same picture. It’s a clever way for a computer to learn without needing hand-crafted labels—just like you figuring out the puzzle on your own!
Generative Models: Variational Autoencoders (VAEs) or Generative Adversarial Networks (GANs) uncover latent distributions to generate new data or detect anomalies.
Now, picture a master artist who has studied countless paintings and can now create entirely new works that capture the same essence. This is the world of generative models:
- Variational Autoencoders (VAEs) act like our artist who distills all the important details of an image into a compact “recipe.” Once the essence is captured, the artist can mix up new creations that look just as captivating.
- Generative Adversarial Networks (GANs) take it a step further with a dynamic duo: one part generates art while the other critiques it. Over time, the generator hones its skills until the artwork is so lifelike, the critic can hardly tell the difference between real and fake. These models are not only great at creating realistic images but can also detect anomalies—much like noticing when something is off in a beautifully composed picture.
3.4 K-Means in Python
Below is a brief example using scikit-learn. It demonstrates data generation, scaling, clustering with K-means, and evaluation with the Silhouette Score:
# 4. Evaluate with Silhouette Score
labels = kmeans.labels_
score = silhouette_score(X_scaled, labels)
print(f"Silhouette Score for k={k}: {score:.3f}")

# 5. Print cluster centers
centers = kmeans.cluster_centers_
print("Cluster centers (scaled):\n", centers)
- Tip: Replace make_blobs with your real dataset.
- Reference: scikit-learn documentation
4.5 Tool Ecosystem for Unsupervised Learning
Here are a few ecosystems that can be used in Unsupervised Learning:
Scikit-Learn:
A go-to Python library offering numerous built-in algorithms for clustering (e.g., K-means, DBSCAN) and dimensionality reduction (PCA, t-SNE). It’s user-friendly, well-documented, and covers a broad range of unsupervised techniques.
TensorFlow / PyTorch:
Ideal for designing neural-network-based models like autoencoders, which learn low-dimensional representations of unlabeled data. For example, TensorFlow’s Autoencoder Tutorial provides a practical introduction to building and training unsupervised neural networks.
Spark MLlib:
A distributed computing library that scales clustering or dimensionality reduction across large datasets. By parallelizing algorithms (like K-means or PCA), Spark MLlib can handle massive data volumes efficiently, making it valuable for enterprise-scale unsupervised tasks.
4. Unsupervised vs. Supervised and Semi-Supervised Learning
Understanding how unsupervised learning compares to other types of machine learning can clear up a lot of confusion. Below is a comparative table that might help:
| Aspect | Unsupervised | Supervised | Semi-Supervised |
|---|---|---|---|
| Data Labeling | No labeled data | Fully labeled data (features + target) | Partially labeled data |
| Objective | Discover hidden patterns (clusters, associations, structure) | Learn to predict known labels or outputs | Combine small labeled set with large unlabeled set to improve accuracy |
| Examples | Clustering (K-means), Dimensionality Reduction (PCA) | Classification (Logistic Regression, Random Forest), Regression (Linear, SVR) | Semi-supervised Classification (Label Propagation, Self-training) |
| Challenges | Lack of straightforward accuracy metrics | Requires labeled data, can be expensive to label | Balancing the labeled vs. unlabeled proportions, ensuring consistent labeling |
The beauty of unsupervised methods is that they can work where labels don’t exist. Supervised methods excel when you have enough annotated data to guide the model. Meanwhile, semi-supervised learning provides a middle ground, making the most of a small labeled set plus a large unlabeled set.
5. Challenges of Unsupervised Learning
Your model can only be as good as the data—and the approach—you feed it. Because unsupervised learning is about discovering unknown structures, it poses unique challenges:
- No Ground Truth for Validation
When there are no labels, it’s hard to say “Yes, that’s right” or “No, that’s incorrect.” Evaluating the quality of the discovered patterns can be subjective or domain-dependent.
Metrics like Silhouette Coefficient or Inertia in clustering help, but sometimes domain knowledge is key.
- Choosing the Right Number of Clusters or Components
For methods like K-means, you need to pick k, the number of clusters. Tools like the Elbow Method or the Gap Statistic can guide you, but there’s no universal rule for all datasets.
PCA also requires you to decide how many principal components to keep, which can feel arbitrary without domain-specific insight.
- Interpretability
Clusters or latent features might look mathematically coherent but be meaningless from a real-world perspective.
This is especially true for complex methods like autoencoders, where it can be hard to interpret the compressed representation.
- Computational Complexity
Large datasets can be very time-consuming for algorithms like hierarchical clustering or t-SNE.
You may need specialized hardware (GPUs) or approximate algorithms to handle high-volume or streaming data.
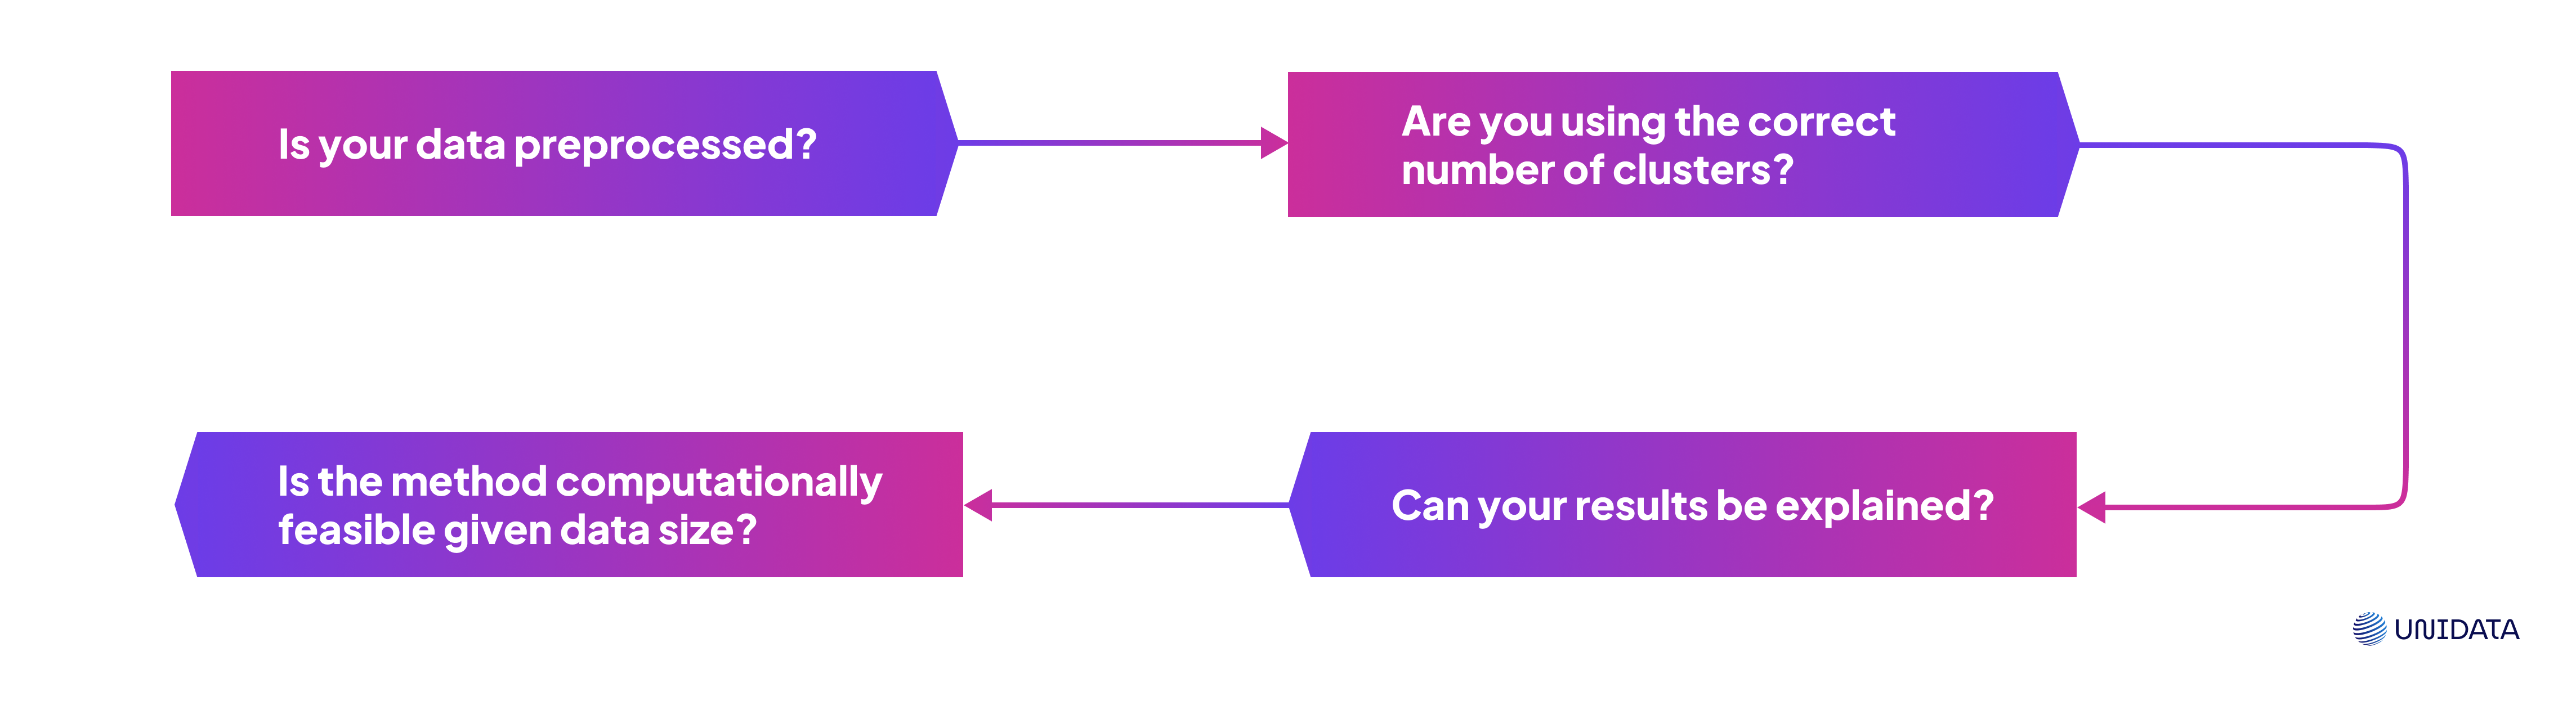
You can follow this logic flow:
Myth-Busting Section
Common misconceptions often lead to misguided expectations:
Myth #1: “Unsupervised learning is only about clustering.”
Reality: It also includes dimensionality reduction (PCA), association rule mining, anomaly detection, and more.
Myth #2: “You can’t evaluate an unsupervised model’s results.”
Reality: While you can’t compute accuracy vs. labels, metrics like the Silhouette Score, reconstruction error (for autoencoders), and domain-based assessments are extremely informative.
Myth #3: “Unsupervised learning automatically yields business value.”
Reality: Discovered patterns must be interpreted through domain knowledge. Otherwise, mathematically sound clusters may not translate to actionable insights.
6. Real-World Applications
From marketing and healthcare to cybersecurity and manufacturing, unsupervised learning finds use cases in virtually every domain.
- Customer Segmentation
Retail and E-Commerce: Grouping customers by buying habits, demographics, or website interactions. Helps tailor personalized marketing campaigns. HBR article on customer segmentation.
A Deloitte retail analytics project found that clustering customer purchase data led to targeted cross-sell campaigns, increasing the average basket size (Deloitte Retail Analytics).
- Fraud Detection
Banking & Finance: Unsupervised anomaly detection algorithms (e.g., DBSCAN, Isolation Forest) spot unusual transaction patterns that might indicate credit card fraud. Because fraudsters evolve constantly, an unsupervised approach can find new types of anomalous behavior without needing labeled examples.
Additional resource: “Anomaly Detection in Credit Card Transactions” on IEEE Xplore.
ECB publications highlight unsupervised anomaly detection for emerging fraud schemes, especially those not present in labeled training sets (ECB Publications).
- Genomics and Healthcare
Gene Expression Analysis: Researchers cluster gene expression patterns to identify subtypes of diseases.
A Nature Genetics paper employed PCA and clustering to discover tumor subtypes, potentially guiding more precise therapies (Nature Genetics).
Patient Risk Grouping: Hospitals use clustering to group patients by risk factors, enabling better resource allocation.
A 2021 NIH study used hierarchical clustering on diabetic patient data to reduce readmission rates by tailoring care to specific risk clusters (NIH.gov).
- Image and Media Analysis
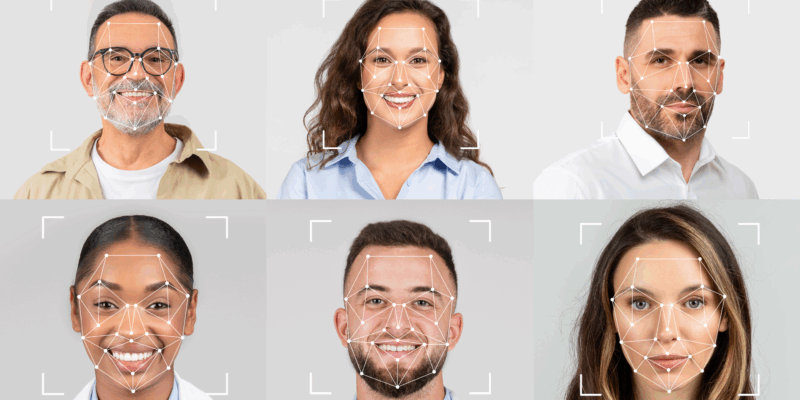
Clustering Similar Images: Online photo storage platforms group pictures by similar faces or scenes without you labeling them first.
Topic Modeling in NLP: Topic modeling (like Latent Dirichlet Allocation) is used to find abstract “topics” in a large corpus of text—helpful for content recommendation or knowledge discovery.
- Recommender Systems
Content-Based Recommendations: While some recommendation engines rely on collaborative filtering (a supervised approach), others use unsupervised methods to cluster items and users, suggesting similar items based on discovered patterns.
7. Conclusion
Unsupervised learning is an essential toolkit for any data scientist or ML enthusiast. It shines when you have a wealth of unlabeled data and a desire to find hidden structures—be that customer groups, fraudulent behaviors, or compressed representations of complex data. While it’s powerful, keep in mind that the interpretability and evaluation of unsupervised models can be tricky. The key is balancing mathematical structure with domain insights.
Further Reading & References:
- Scikit-learn Documentation
- Market Basket Analysis with Apriori on Kaggle
- Customer Segmentation Case Study by Deloitte
- HBR on Customer Segmentation
- IEEE Xplore: Anomaly Detection in Credit Card Transactions
- ECB Publications
- NIH.gov
- Nature Genetics
- deeplearning.ai
- TensorFlow’s Autoencoder Tutorial
- Spark MLlib