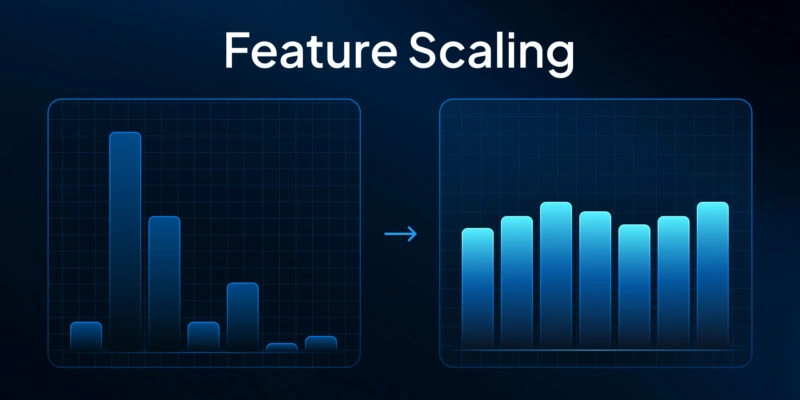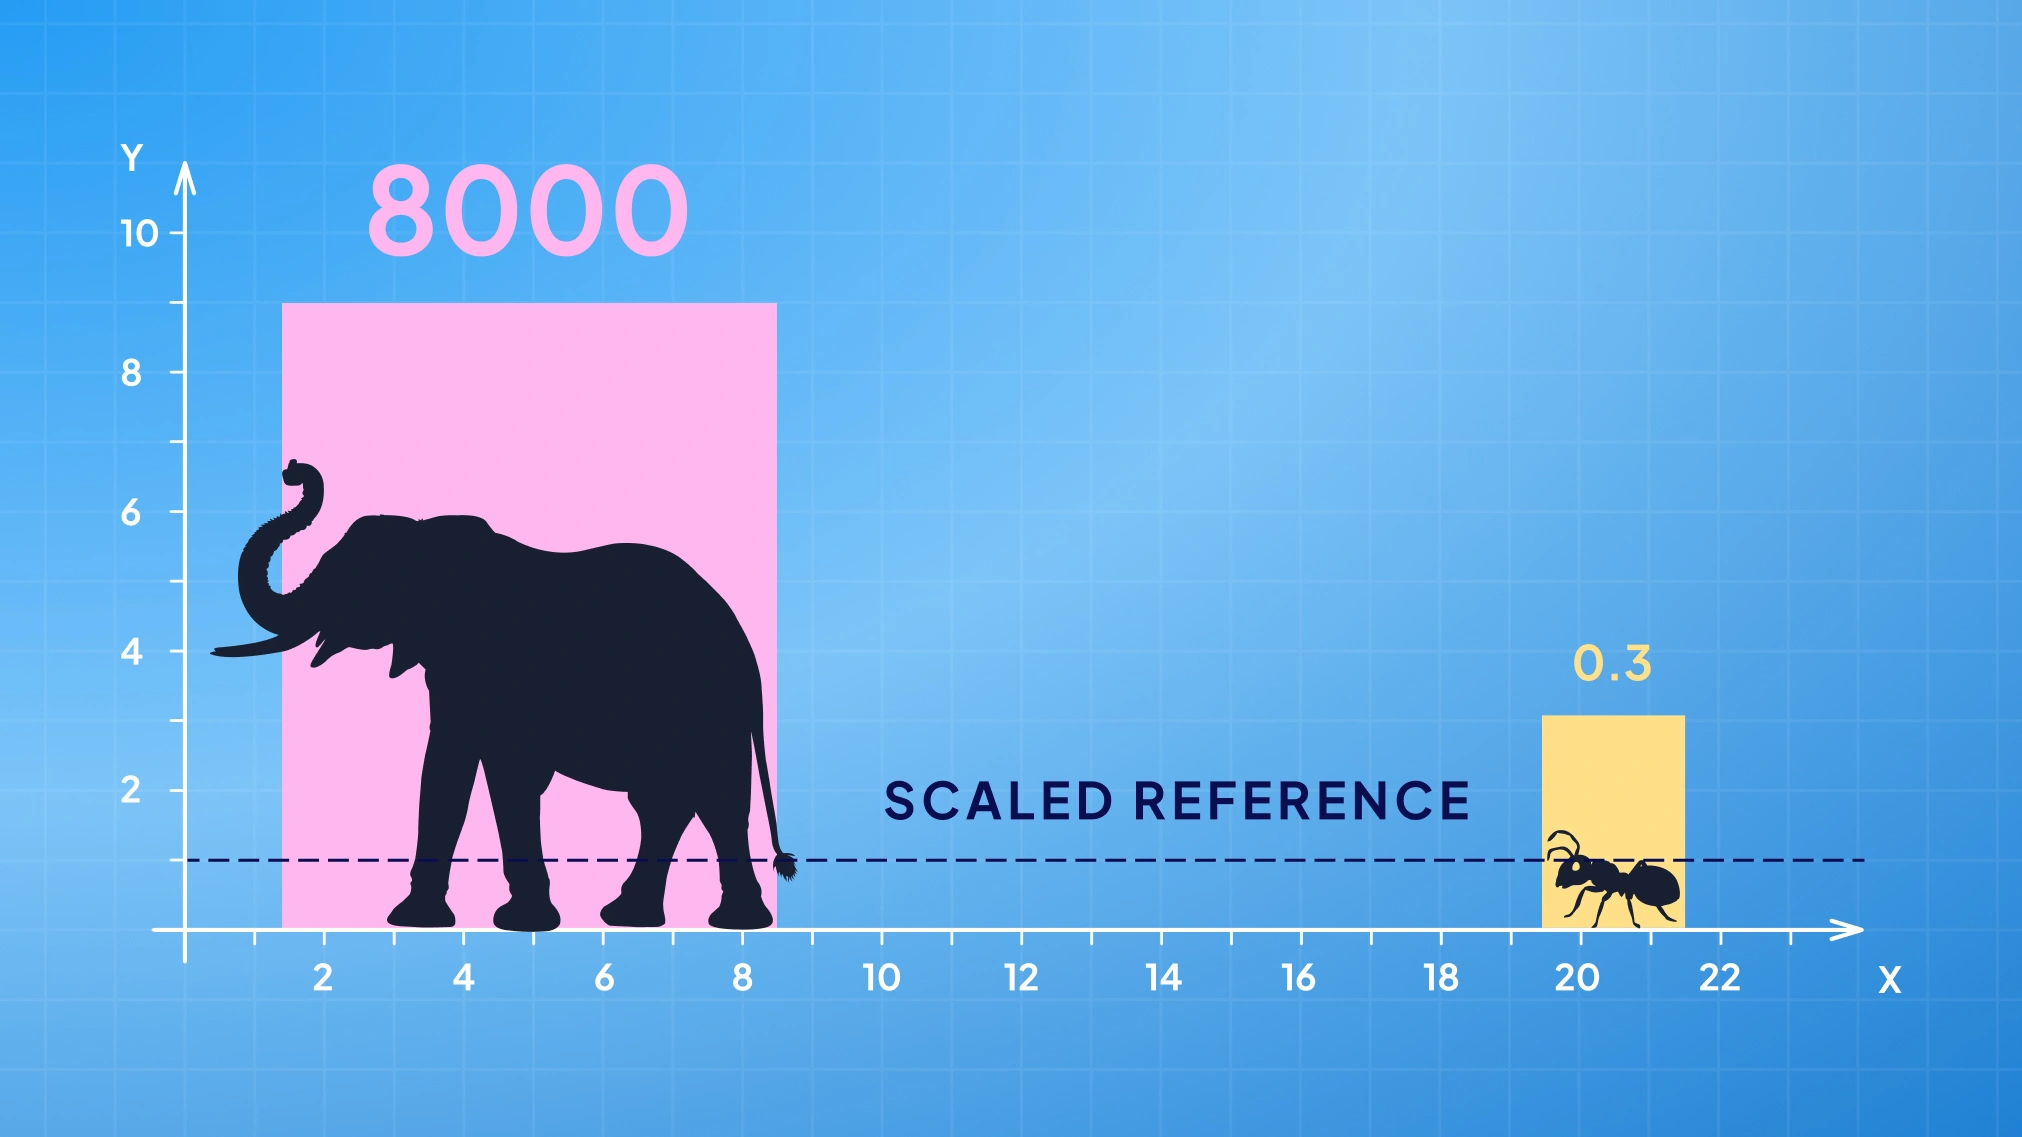
Imagine your ML model as a judge at an interspecies weightlifting contest, comparing an ant to an elephant. If features like weight aren’t scaled, the elephant (with its huge number) wins every time, and the ant might as well not exist. In data terms, one feature’s large values can completely overpower another’s small values. Normalization and standardization are the two trusty referees that level this playing field, shrinking or shifting feature values so that every feature gets a fair say.
In this article, we’ll unpack the differences between these scaling techniques, when to use each, and how they impact model accuracy, convergence, and algorithm behavior. Let’s dive in!
Normalization vs Standardization: The Key Difference Explained
Normalization vs standardization. Same goal — different routes. Both are types of feature scaling that put features on a common scale, but they get there in different ways.

- Normalization (or min-max scaling) squeezes every feature into a predefined range, often 0 to 1. Take the minimum value, subtract it, then divide by the range. Done.
- Standardization (or z-score normalization) shifts the original data so the mean is 0 and the standard deviation is 1. Each number is measured in “how many σ from the mean.” That creates a standard normal distribution (scikit-learn.org).
Think of it this way: normalization locks values into a box from 0 to 1. Standardization re-centers everything around zero and gives each feature unit variance.
| Aspect | Normalization (Min-Max) | Standardization (Z-Score) |
|---|---|---|
| Method | Rescale to [0,1] using min/max. | Subtract mean, divide by std. |
| Result | Features shrink into a fixed bounding range. | Features spread around 0, usually −3σ to +3σ. |
| Formula | $^{x}norm=\frac{x-min(x)}{max(x)-min(x)}$ (maps min→0, max→1). | $z=\frac{x-\mu }{\rho }$ (transforms mean μ to 0, std σ to 1). |
| Outliers | Skews easily. One extreme point can squash the rest. | Less fragile — outliers sit far in the tails. |
| Best For | Features on different scales, distance-based models, some artificial neural networks. | Linear regression, PCA, SVM — anything that depends on the mean vector or variance. |
Both are practical transformations that help machine learning models work with balanced inputs. In some papers, you’ll see z-score normalization casually called “normalization.” Don’t let it trip you up — here we keep the terms clear.
Both scaling methods are easy to apply with Python libraries like scikit-learn. For example, here’s how you can normalize and standardize features using scikit-learn:
import numpy as np
from sklearn.preprocessing import MinMaxScaler, StandardScaler

# Sample data: two features with very different scales (e.g., [height_in_meters, weight_in_grams])
X = np.array([[1.8, 5000],    # Person A: 1.8m tall, 5000g (5kg)
              [1.6, 60000],   # Person B: 1.6m tall, 60000g (60kg)
              [1.75, 75000]]) # Person C: 1.75m tall, 75000g (75kg)

minmax = MinMaxScaler()
X_normalized = minmax.fit_transform(X)

scaler = StandardScaler()
X_standardized = scaler.fit_transform(X)

print("Normalized:\n", X_normalized)
print("Standardized:\n", X_standardized)
Running this code would output something like:
Normalized:
 [[0.667   0.      ]
  [0.      0.73333]
  [1.000   1.000   ]]

Standardized:
 [[ 0.267  -1.135]
  [-1.336   0.162]
  [ 1.069   0.973]]
Here’s what the numbers look like after scaling:
- In the normalized data, height shrinks neatly into the [0,1] predefined range. For example, 1.6 m becomes 0.0, 1.8 m becomes ~0.667, and 1.75 m tops out at 1.0. Weight follows the same logic: 5 kg → 0, 75 kg → 1.
- In the standardized output, each feature has mean ≈ 0 and unit variance. Heights and weights are now centered around zero. Some values dip negative, others positive, but most fall within a few standard deviations, just as you’d expect under a Gaussian distribution.
The difference is simple: normalization squashes features into a [0,1] range, while standardization recenters them at zero with unit variance. Normalization changes the scale, standardization changes both the center and the spread.
Normalization in Machine Learning: Min-Max Scaling and Bounded Ranges
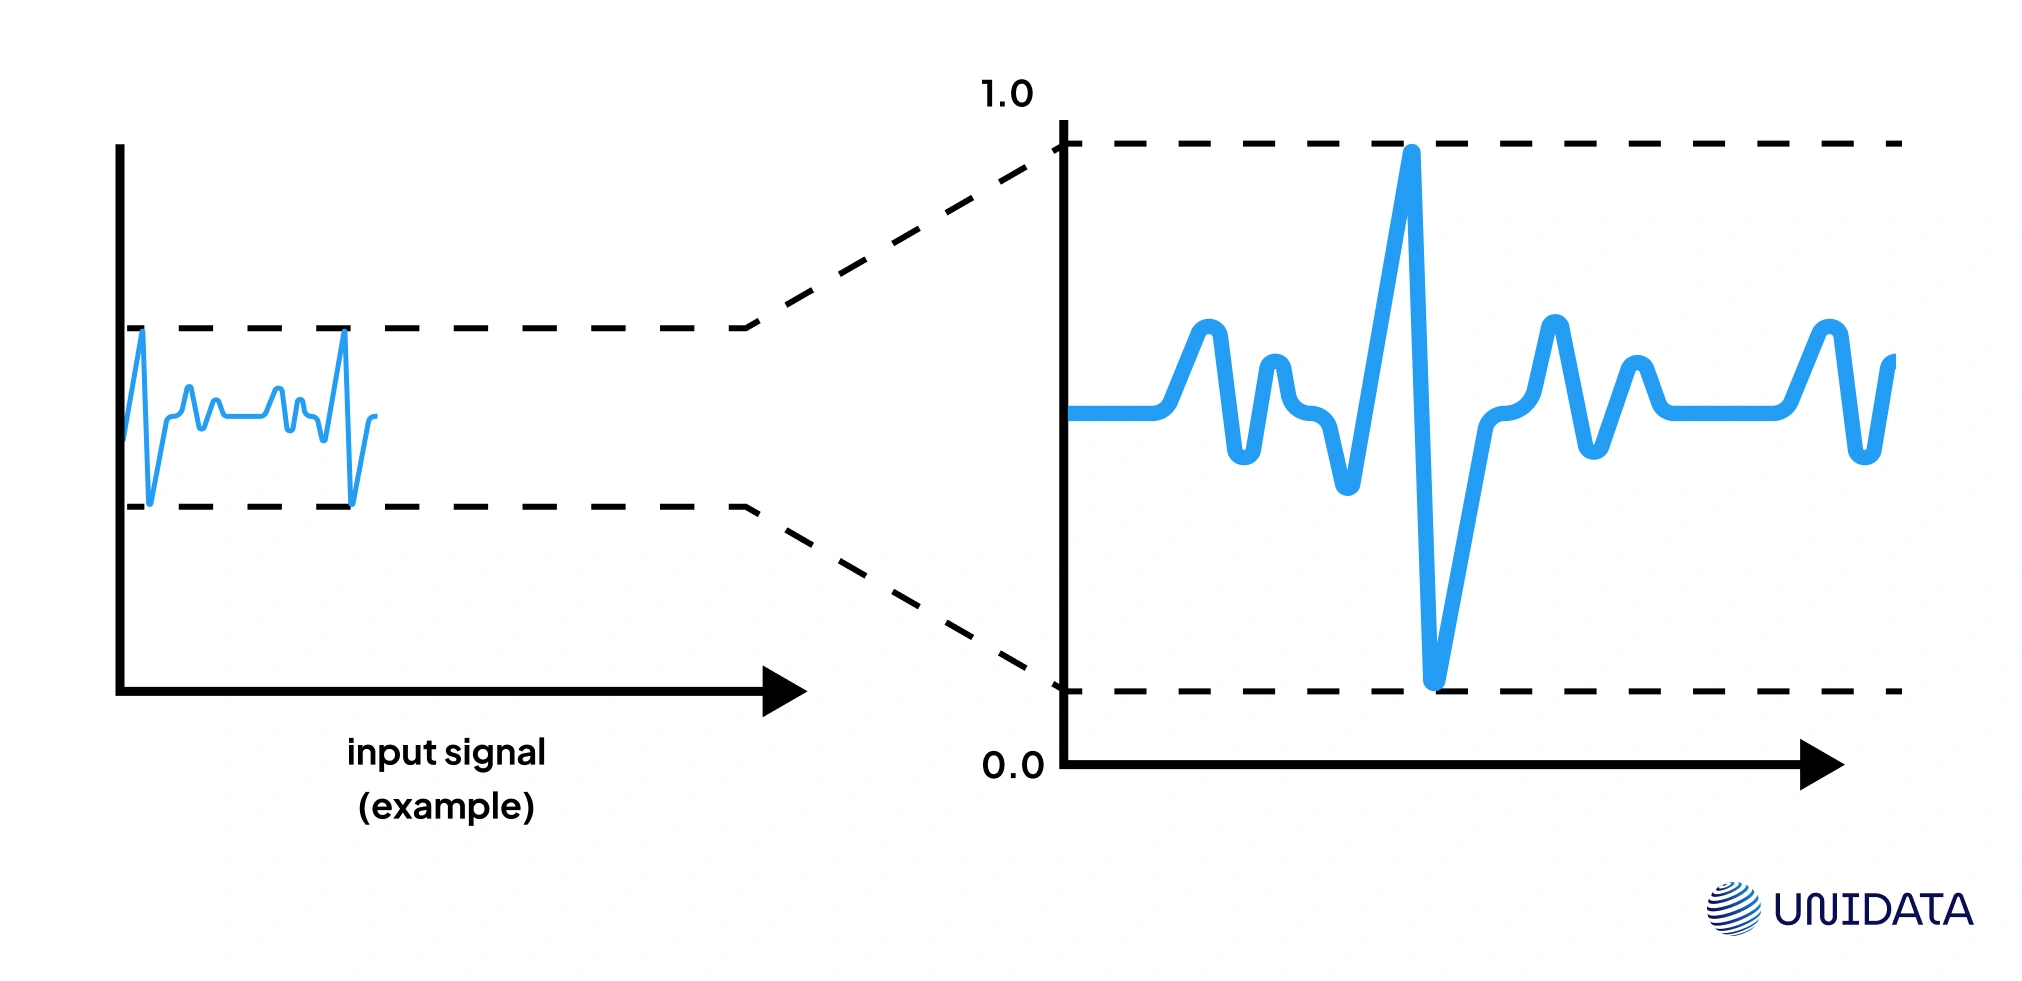
Normalization takes raw numbers and squeezes them into a fixed range, usually [0,1]. This simple transformation ensures every feature contributes on a common scale, no matter how wildly their original values differ.
Formula:
$$x^{'}=\frac{x-min(x)}{max(x)-min(x)}$$
- The minimum value maps to 0.
- The maximum value maps to 1.
- Everything in between is scaled proportionally.
Why it matters
Think about pixel intensities in an image dataset. Values may run 0–255. A neural network with a sigmoid activation function will train faster if all pixels are normalized to [0,1]. Same idea with percentages, or distances in k-NN — without normalization, one feature with a larger range can dominate the distance metric.
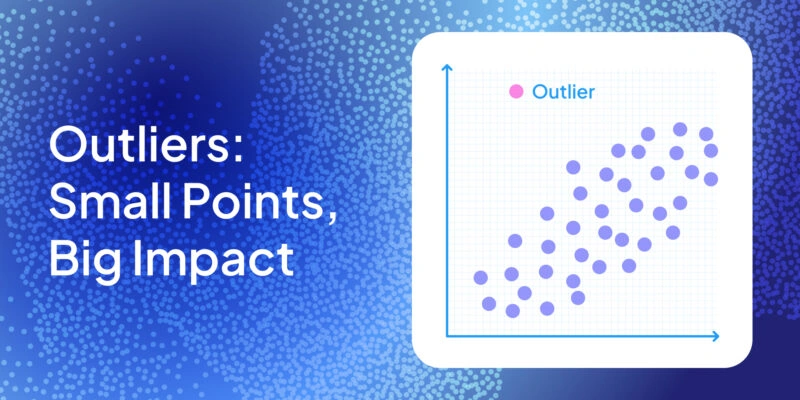
Outlier sensitivity
Here’s the catch: one extreme outlier can shrink the rest of the feature distribution into a tiny band near 0. For example, if incomes in a dataset range from $20k to $70k, and you suddenly add a billionaire at $10M, everyone else gets crammed into values close to zero. This is where range restrictions matter — normalization works best when the data doesn’t contain extreme values.
Geometric view
Geometrically speaking, min-max scaling maps features into an n-dimensional unit hypercube. Every feature now sits between 0 and 1, making comparisons fair across axes. That’s why distance-based algorithms (like k-Means or k-NN) benefit so much — each axis carries equal weight in the distance calculation.
In practice
- Use in artificial neural networks when inputs feed into activation functions that expect bounded values.
- Ideal for features with different scales but known natural bounds (like percentages or exam scores).
- Not the best choice when you expect high incomes or other heavy outliers — in those cases, consider robust scaling instead.
Standardization in Machine Learning: Z-Score Normalization
While normalization squeezes features into [0,1], standardization takes a different route. It shifts data so that every feature has a mean of 0 and a unit standard deviation. Instead of bounding values, it measures how far each point sits from the average in terms of σ.
$$z=\frac{x-\mu }{\rho }$$
- Subtract the mean (μ) → centers the data at zero.
- Divide by the standard deviation (σ) → rescales spread to 1.
- The result is the classic z-score normalization.
Why it matters
If your features follow something close to a Gaussian distribution, standardization transforms them into a standard normal distribution — mean 0, σ 1. Many algorithms (like linear regression, SVMs, and PCA) assume data is centered and scaled. Without it, one feature with high variance can dominate while others get ignored.
Outlier behavior
Unlike min-max, standardization doesn’t trap values inside a box. Outliers remain in the tails — a point at +3σ is still visible, not squashed flat against 1. That makes it more robust when dealing with real-world feature distributions that rarely fit neatly into a bounded range.
Geometric view

Geometrically speaking, standardization re-centers all features around the origin of the coordinate system. In n-dimensional data, this means the mean vector is moved to (0,0,…,0), and each axis has unit variance. Distances and directions now reflect relative spread, not arbitrary measurement units.
In practice
- Crucial for algorithms that rely on variance or dot products: PCA, logistic regression, and support vector machines.
- Improves stability for gradient descent optimizers by putting features on a comparable scale.
- Useful in domains like finance, where values are compared as “σ shifts” from the mean (volatility-adjusted returns).
A suitable choice when data has no natural bounds but must be compared fairly.
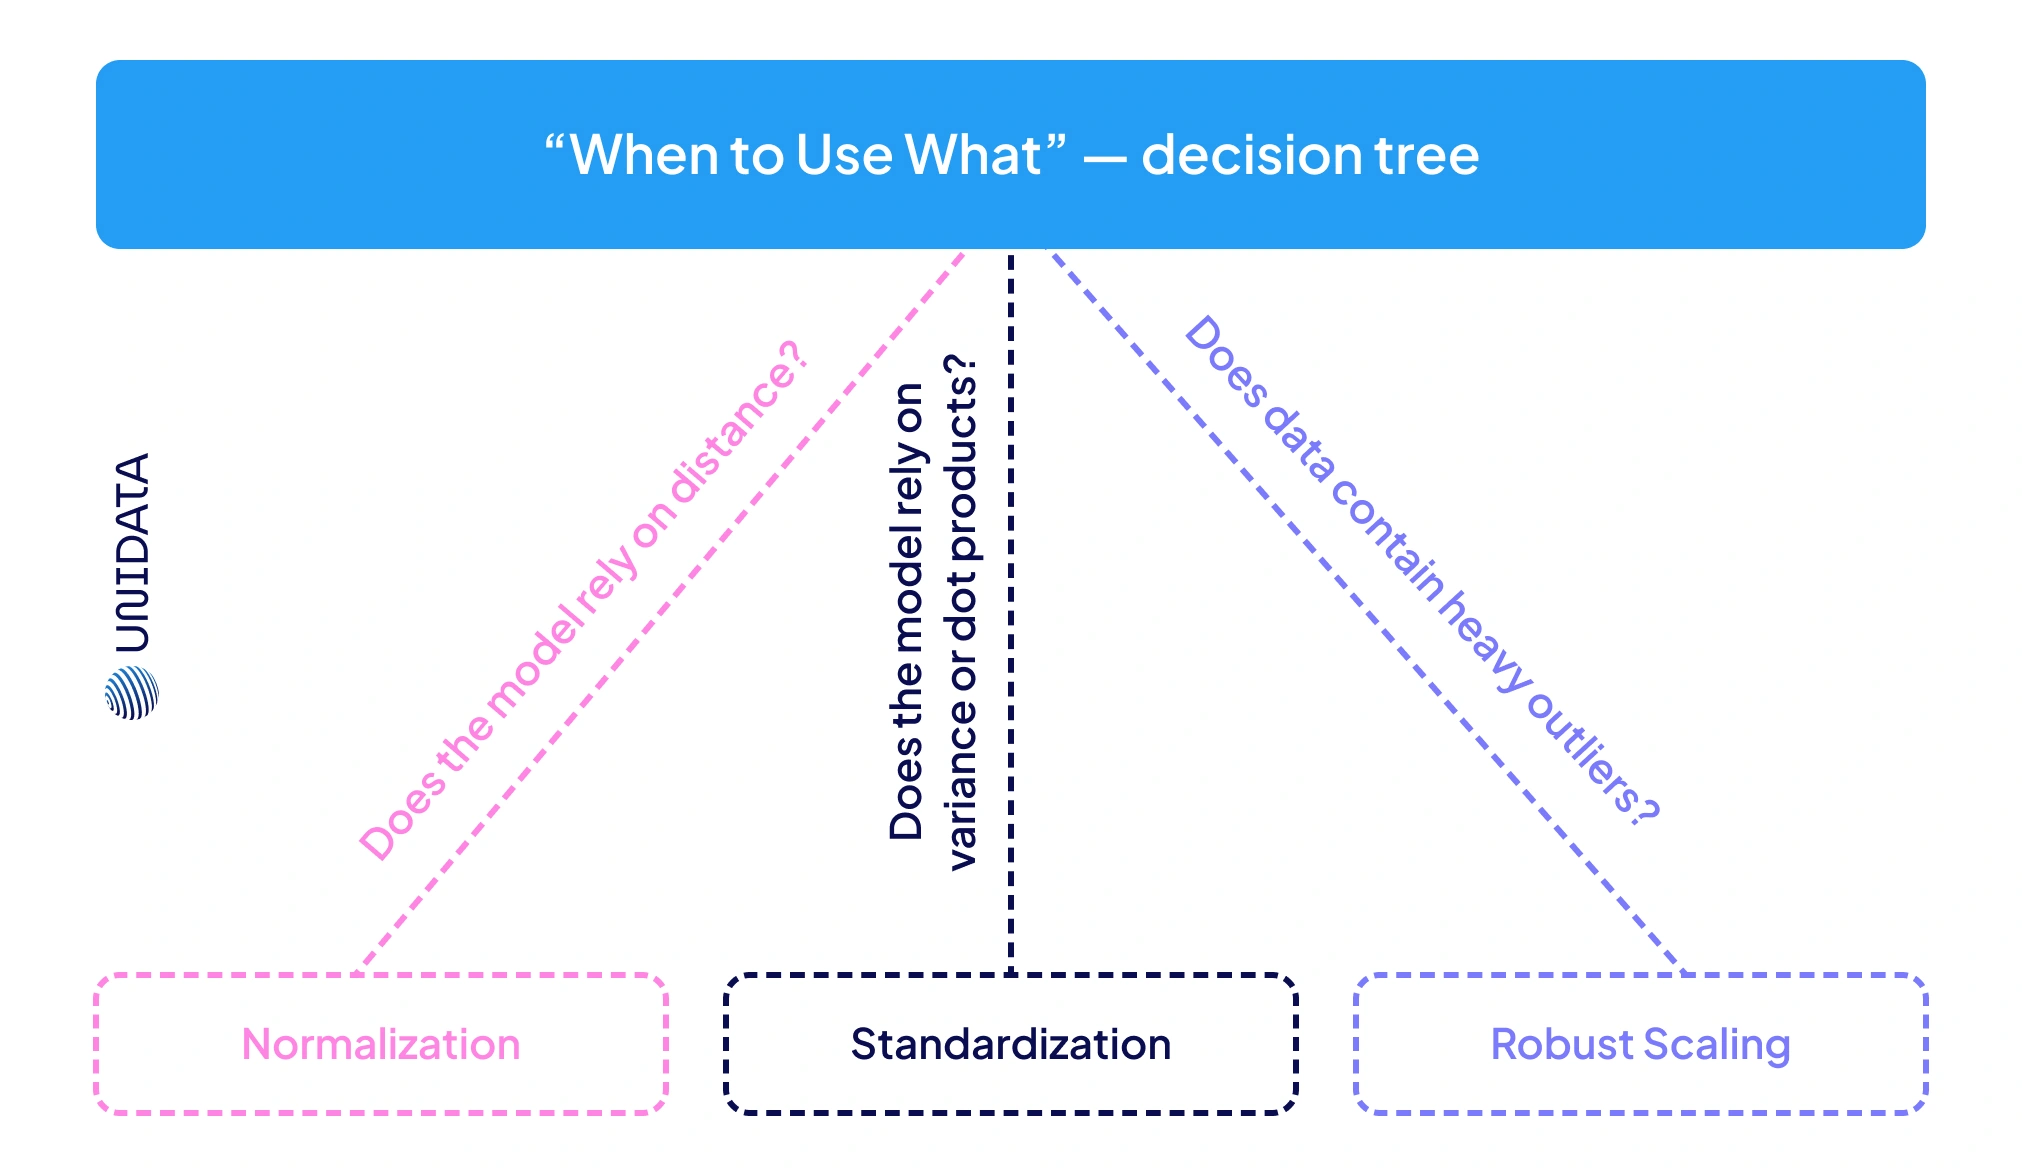
When to Use Normalization vs Standardization in Data Science
Choosing between normalization and standardization comes down to two things: your algorithm and your data distribution.
- Use normalization (min–max scaling) when your model needs inputs in a predefined range, usually [0,1]. This is common in artificial neural networks with activation functions that expect bounded numbers. It’s also a good choice when you want features with different scales — like pixel intensities, percentages, or distances in k-NN — to line up on a common scale.
- Use standardization (z-score normalization) when your features look roughly like a Gaussian distribution, or when the algorithm assumes centered data. It’s the go-to for linear regression, logistic regression, SVMs, and PCA, where having mean 0 and unit variance is crucial. Any model that uses gradient descent (from deep nets to iterative regression solvers) tends to train more smoothly on standardized inputs.
In practice, match the method to the job:
- Distance-based algorithms (k-NN, k-Means) don’t care which scaling method you use, but they break without scaling at all. Normalization is often the suitable choice here.
- Gradient-based algorithms (deep learning, SVM with RBF kernels) often lean toward standardization, since zero-mean inputs keep optimizers stable.
Data characteristics also matter. If a feature has a natural bounded range — say exam scores from 0 to 100 — normalization preserves that structure by mapping it proportionally to [0,1]. If instead you want to measure values in terms of “how far from average,” standardization makes sense: a feature value of +2σ tells you it’s two standard deviations above the mean.
There’s no single suitable choice. Sometimes you’ll try both and pick whichever makes the machine learning model perform better. And if your dataset is full of outliers or high incomes that distort scaling, neither method is perfect — consider a robust scaling normalization, which uses medians and IQRs to avoid letting extremes dictate the transformation.
How Normalization and Standardization Impact Model Accuracy and Convergence
Feature scaling can make or break your model’s performance. When features sit on wildly different scales, algorithms can stumble: some take forever to converge, others make poor predictions because small-scale features vanish in the noise.
Impact on Convergence
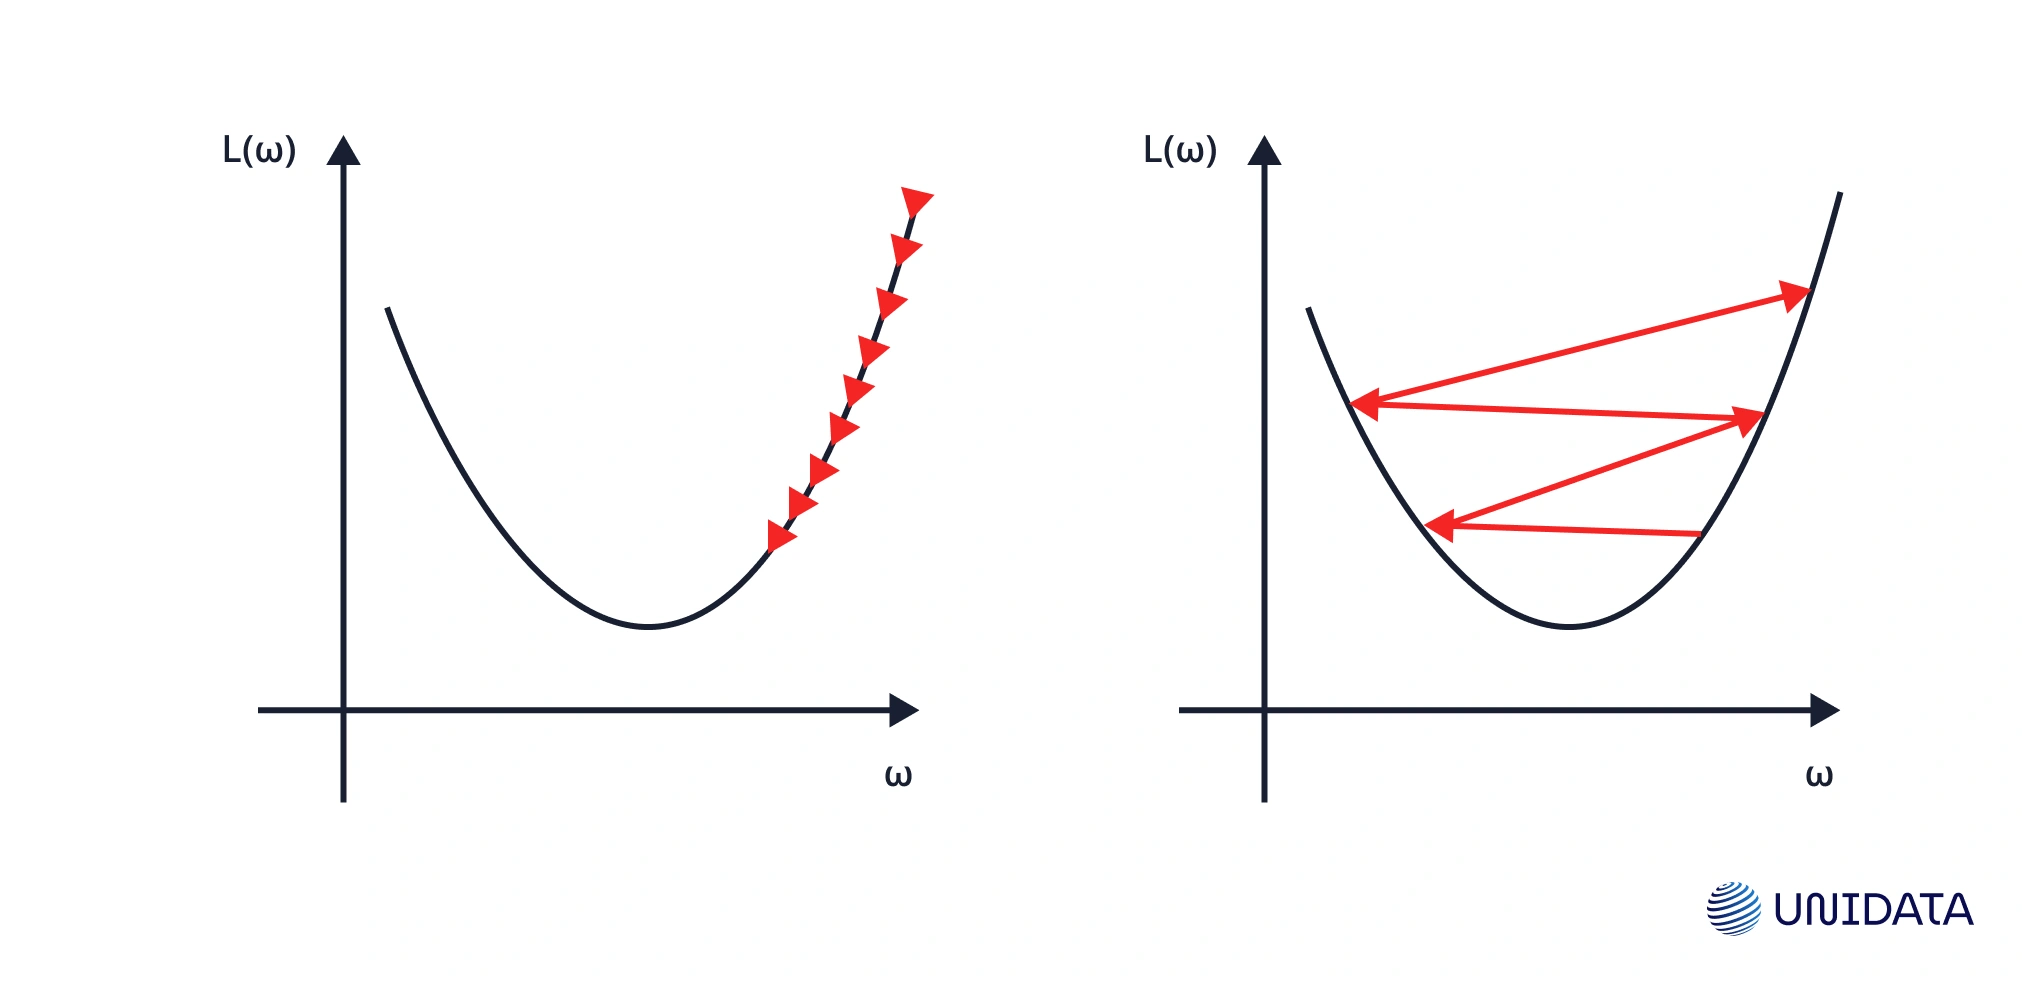
Models trained with gradient descent — think linear regression, logistic regression, or artificial neural networks — need features on a similar scale. If one feature ranges in thousands and another in decimals, the error surface gets stretched. Gradient descent zig-zags, wasting iterations.
Scale the inputs and the surface becomes smoother. Optimizers take direct steps toward the minimum, training faster and more reliably.
Impact on Accuracy
Some algorithms create predictions by comparing distances. Take k-Nearest Neighbors: if one feature ranges 0–1000 and another 1–10, the larger range dominates. The model ignores the smaller feature, leading to skewed boundaries. Apply scaling, and both features contribute fairly.
The same problem hits linear models. A feature with large variance can dominate the coefficients and warp the fit. Standardization fixes this by re-centering values around the mean with unit variance, so no single feature bulldozes the others.
Which Algorithms Require Normalization or Standardization in ML?
Not every machine learning model cares about scaling, but many do. Here’s the rundown:
Sensitive to Scaling
- Distance-based algorithms: k-NN, k-Means, DBSCAN, and SVMs with RBF kernels all depend on distances in n-dimensional data. If one feature ranges 0–1000 and another 0–1, the larger range dominates the feature distribution. Scaling ensures each variable contributes on a common scale.
- Gradient-based algorithms: Models trained with gradient descent — linear regression, logistic regression, and artificial neural networks — converge faster on inputs with similar ranges. Without scaling, large features can swamp small ones, slowing training. SVMs also assume features are standardized to mean 0 and unit variance.
- PCA and decompositions: PCA identifies directions of maximum variance. Without scaling, features with massive spread overwhelm the analysis. After standardization, components reflect relative, not absolute, variance, and the model can function correctly.
- Regularized models: Ridge and lasso penalize coefficients. If features aren’t standardized, penalties hit unevenly. Scaling makes regularization fair and improves how the model perform on unseen data.
Less (or Not) Sensitive
- Tree-based algorithms: Decision Trees, Random Forests, and Gradient Boosted Trees split on thresholds. They’re scale-invariant — whether features are in dollars or euros, the splits stay the same.
- Naive Bayes: Works on probability distributions. Scaling changes the parameters, but not the outcome. Only extreme values may justify mild scaling.
- Analytical linear regression: Solved via the normal equation, predictions are scale-invariant. Still, scaling can stabilize calculations with very large or very small ranges.
- Other clustering: Hierarchical clustering with Euclidean distance behaves like k-Means (needs scaling). Graph-based methods may be less sensitive.
Rule of Thumb
If an algorithm relies on distances, gradients, or dot products, apply normalization and standardization. If it’s based on ordering (like tree splits), scaling is optional.
Best Practices for Applying Normalization and Standardization
A few simple rules make normalization and standardization work the way they should in machine learning models:
1. Apply after splitting
Always split into train/test first. Fit on the training set, then transform the test. If you normalize or standardize the whole original data, you leak global stats and give the model an unfair peek.
2. Pick the right method
- MinMax (normalization): squeeze features into a [0,1] predefined range.
- Standard (standardization): center around mean 0 with unit variance, ideal for Gaussian-like feature distributions.
- RobustScaler: better if you’ve got heavy outliers or high incomes.
- MaxAbsScaler: handy for sparse n-dimensional data.
3. Don’t normalize what doesn’t need it
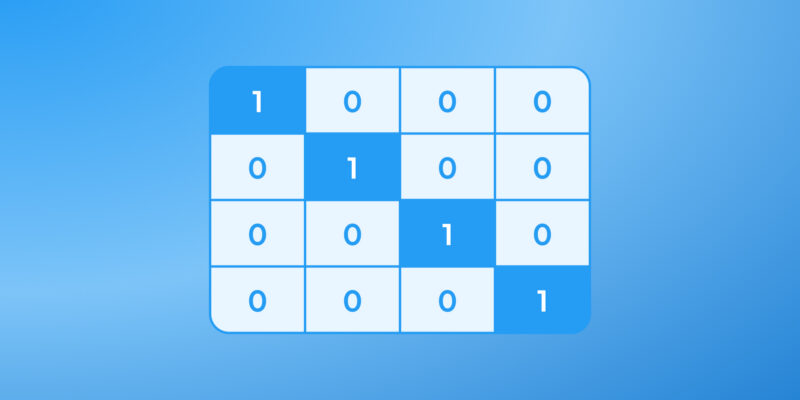
Binary 0/1 flags or one-hot categories are already on a common scale. Leave them as they are, unless you’re working with embeddings.
4. Check the results
After normalization or standardization, confirm your model perform actually improves. Look at summary stats: mean ≈ 0, σ ≈ 1 for standardization; bounds [0,1] for normalization. This check ensures your model can function correctly.
5. Keep interpretability in mind
Normalization hides raw units; standardization reframes them in “σ shifts.” If stakeholders need the original meaning, map coefficients back to the original data.
Conclusion
Normalization and standardization turn messy inputs into reliable features. Geometrically speaking, both are simple transformations that let machine learning models perform and function correctly. From handling high incomes outliers to mapping data into an n-dimensional unit hypercube, these methods make sure your original data becomes clean, fair, and ready for production.