Machine learning has changed many industries. But the most important part — the datasets that train those systems — often stays unclear. If datasets are the fuel of AI, then datasheets are like a mechanic’s log book. They show where the fuel came from, how it was handled, and what flaws it might carry. Without this kind of documentation, machine learning models can go wrong in unexpected ways. For example, facial‑analysis systems have been found to classify light‑skinned men correctly less than 1% of the time. But for dark‑skinned women, the error rate jumps to over 33% (news.mit.edu).
This article shows how datasheets for datasets create clarity and accountability in artificial intelligence. It also looks at related documentation tools, shares examples from real companies, and gives a hands-on guide for making your own datasheet.
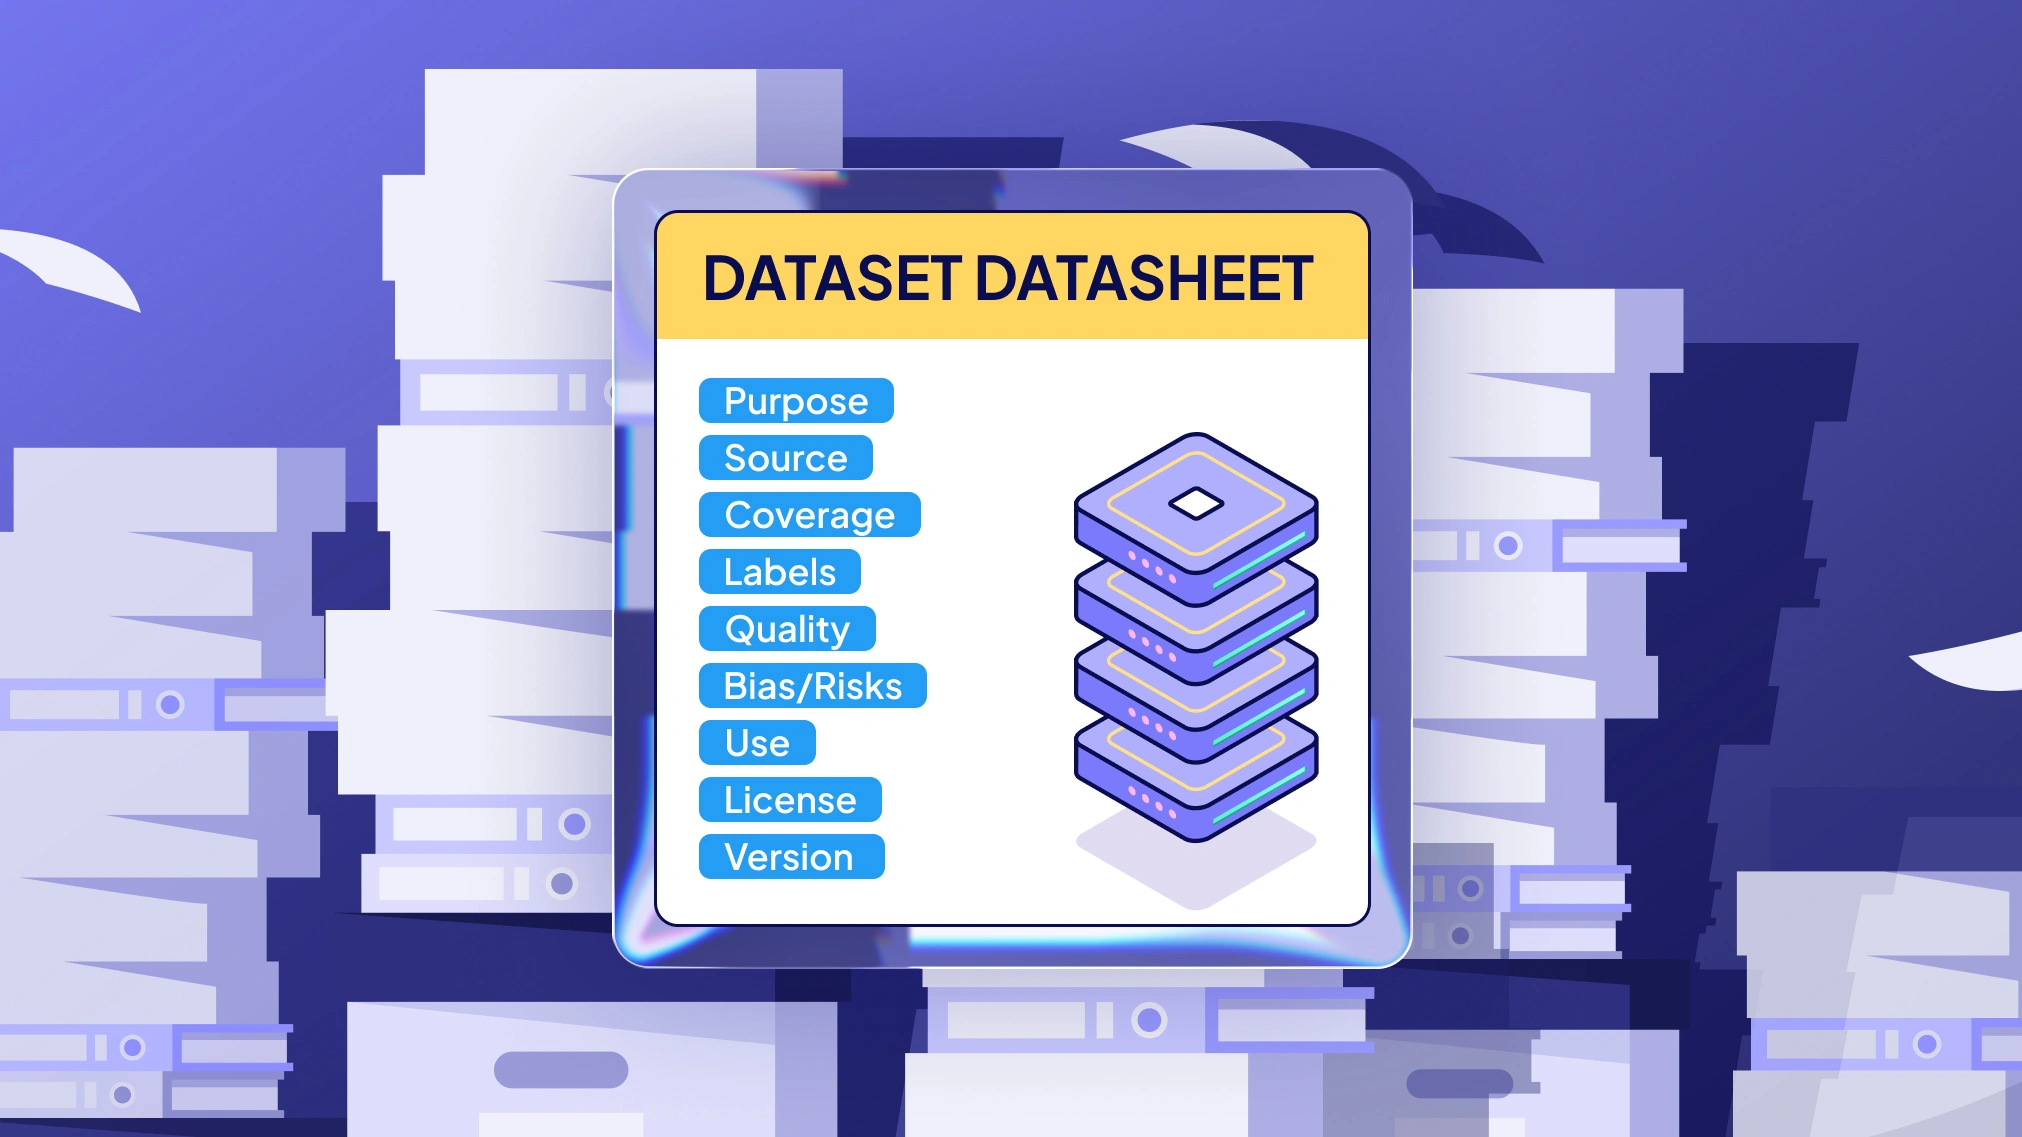
What Is a Datasheet for Datasets?
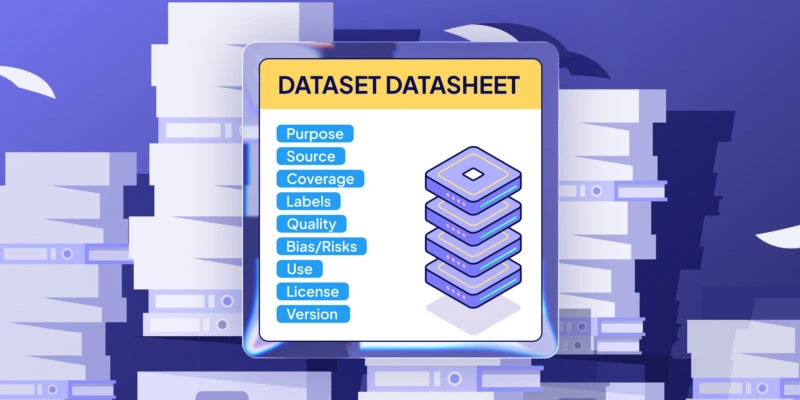
The term datasheet for datasets comes from a key 2018 paper by Timnit Gebru and her team. They took a page from electronics, where parts come with datasheets listing their operating characteristics. In the same spirit, they proposed that every machine learning dataset should include a datasheet. This document should describe how the data was created, what it’s made of, how it was collected, how to use it, and how to keep it up to date.
The authors pointed out a major issue: there’s no standardized way to document datasets. But without that, mismatches between training datasets and real-world uses — or hidden bias — can cause serious problems. That’s especially true in high-stakes domains like criminal justice, hiring, critical infrastructure, and finance. A datasheet works like a structured reference. It explains why the dataset was made, what’s inside it, how it was gathered, and how it should — or should not — be used.
Even though the idea started in academia, it struck a chord with both dataset creators and policy makers. The Communications of the ACM summed it up well: data drive machine learning systems, but we lack clear standards to document dataset context and contents. Datasheets help fix this gap. They record the motivation, composition, collection process, and recommended uses of a dataset (cacm.acm.org). By making all of this clear, datasheets increase transparency, reduce unwanted biases, support greater reproducibility, and help dataset consumers choose wisely (cacm.acm.org).
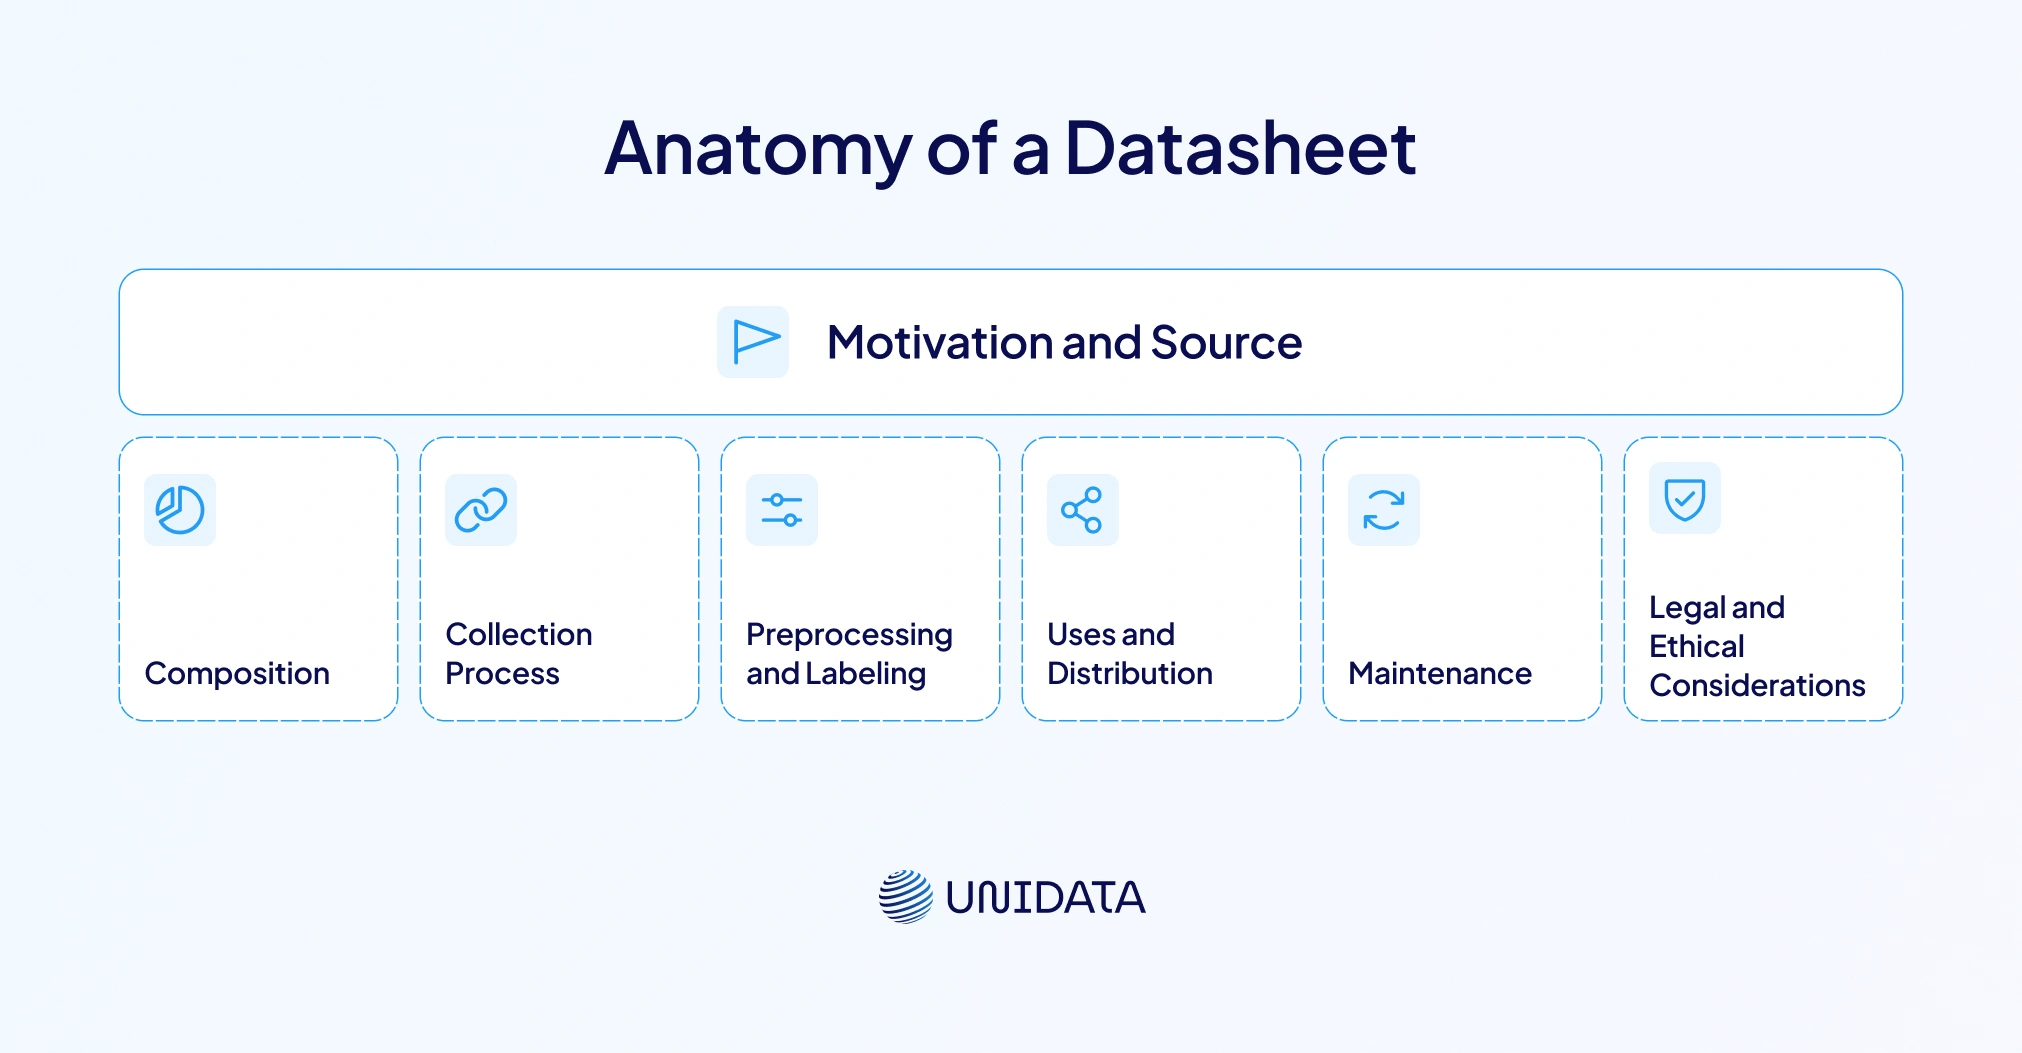
Anatomy of a Datasheet
There are seven recommended categories of questions to be addressed:
| Category | Purpose |
|---|---|
| Motivation and Source | Explains why the dataset was created. |
| Composition | Describes what data the dataset contains and who the data subjects are. |
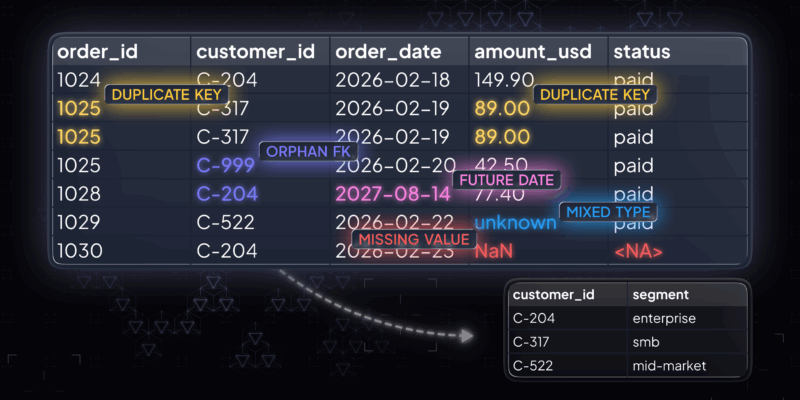
| Collection Process | Documents how the data were gathered. |
| Preprocessing and Labeling | Details any processing, transformations or labeling applied. |
| Uses and Distribution | Outlines intended uses, recommended uses and potential misuse. |
| Maintenance | Notes versioning, updates and deprecation plans. |
| Legal and Ethical Considerations | Explores privacy, consent and intellectual‑property issues. |
This question‑and‑answer template may seem exhaustive, but it ensures that dataset creators reflect on critical issues before releasing data and that dataset consumers have the information needed to make responsible decisions.
Why Documentation Matters in High‑Stakes Domains
Machine learning is now used in sensitive areas — like healthcare diagnostics, loan approvals, facial recognition, and hiring. In these cases, errors aren’t just bugs — they can cause real harm. As noted in the ACM article, mismatches between training datasets and deployment settings — or hidden bias — can lead to severe consequences. This is especially true in high-stakes domains like criminal justice, hiring, finance, and critical infrastructure (cacm.acm.org). Without proper documentation, these mismatches are hard to spot — or fix.
Take facial-analysis systems as an example. A well-known 2018 study found that gender classification errors were just 0.8% for light-skinned men. But for dark-skinned women, the error rate jumped to over 20% — and in some cases, up to 34.7% (news.mit.edu). The main problem? Skewed datasets. Most of the data came from male, white faces. Without a datasheet describing the dataset’s composition, developers and dataset consumers couldn’t judge whether the system was fair. In healthcare, poor representation in training datasets can lead to wrong diagnoses. In hiring, biased data can reinforce discrimination. These examples show why documenting machine learning datasets matters. Good documentation helps make bias visible and prompts critical review — before harm is done.
Value for Dataset Creators and Consumers
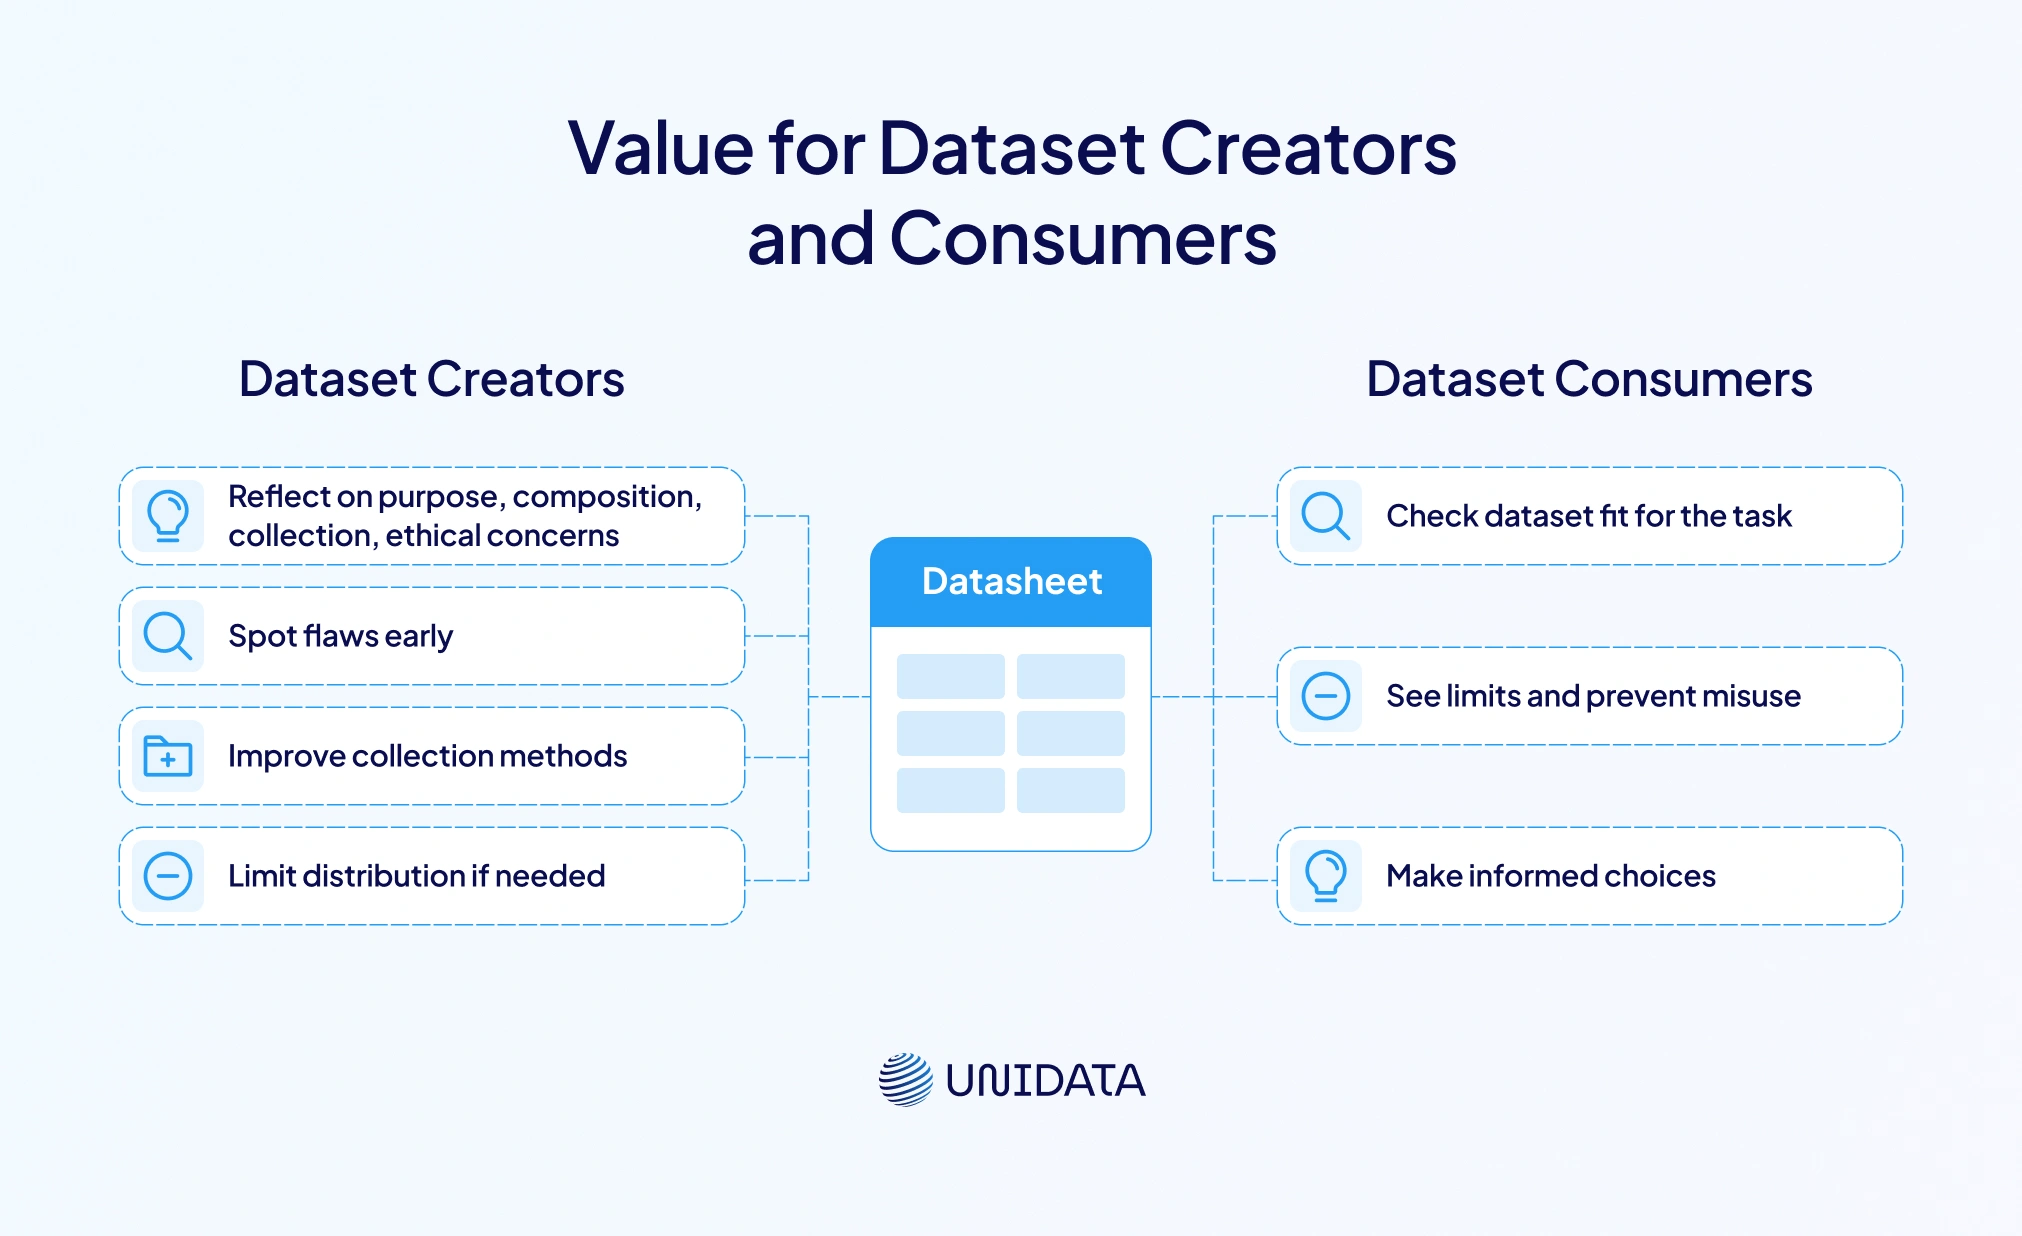
Datasheets are useful for everyone in the machine learning community — both dataset creators and dataset consumers. For creators, writing a datasheet is a chance to reflect. It pushes them to think carefully about the dataset’s purpose, its composition, how it was collected, and any ethical concerns. The ACM article says this process helps creators spot flaws early. They might improve collection methods or decide to limit the dataset’s distribution (cacm.acm.org). It can also reveal gaps in consent or unclear intellectual property rights.
For dataset consumers — like researchers, engineers, business leaders, or policymakers — a datasheet works like a product spec. It helps them figure out if the dataset fits the chosen task. It also shows limits and helps prevent misuse. According to the ACM, datasheets help consumers make informed choices. In highly regulated fields like finance or healthcare, datasheets can also make audits easier and prove responsible data use.
In the end, datasheets build trust and transparency between dataset creators and consumers. By sharing clear details about composition and constraints, creators give others the tools to check fairness and reproduce results. In return, consumers can ask better questions, choose the right datasets, and create machine learning systems that work more reliably.
Mitigating Bias
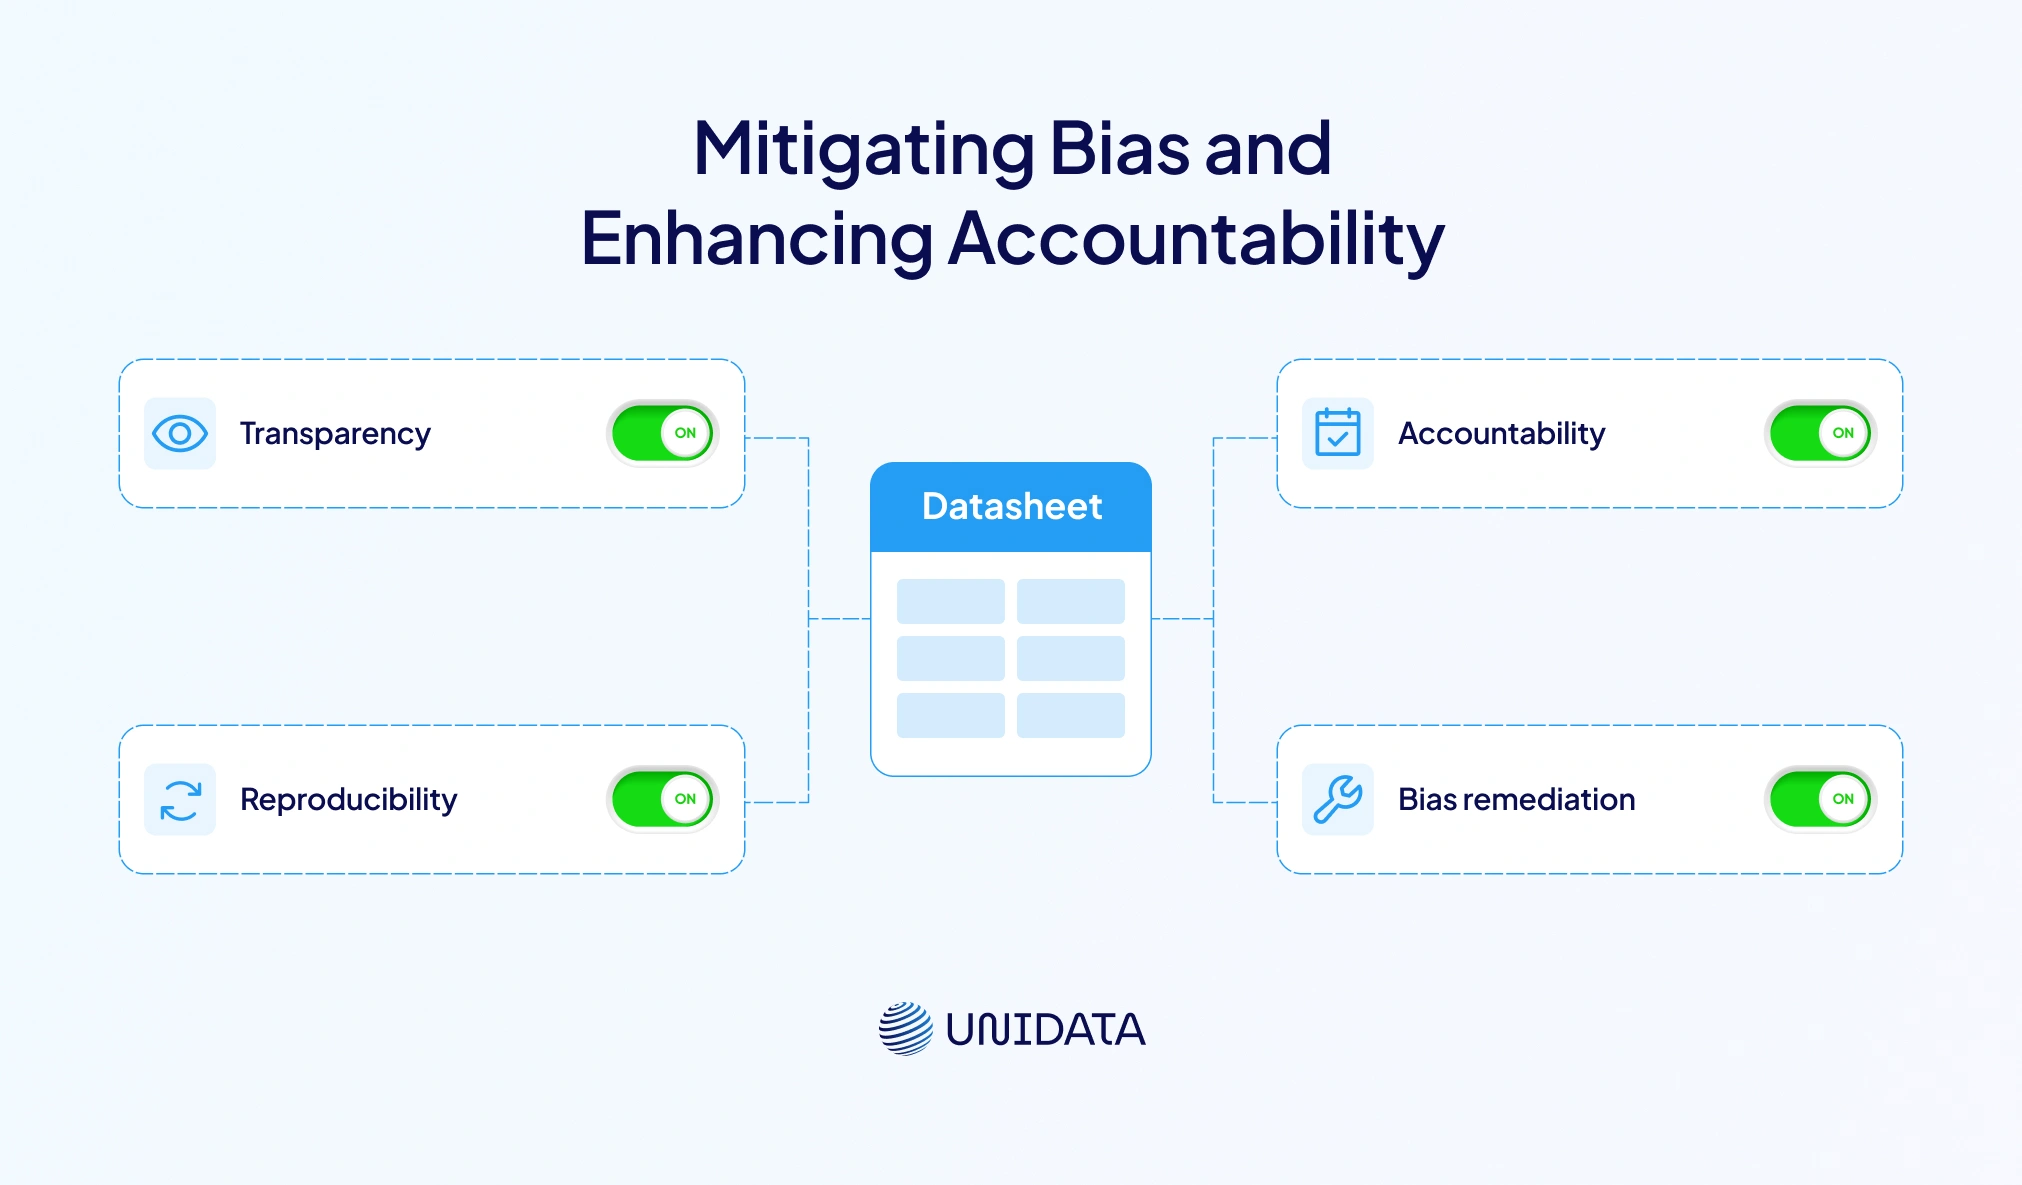
Datasets can encode numerous kinds of biases — demographic, geographical, temporal or cultural. When these biases go undocumented, machine‑learning models may perpetuate or exacerbate them. Datasheets help mitigate biases in several ways:
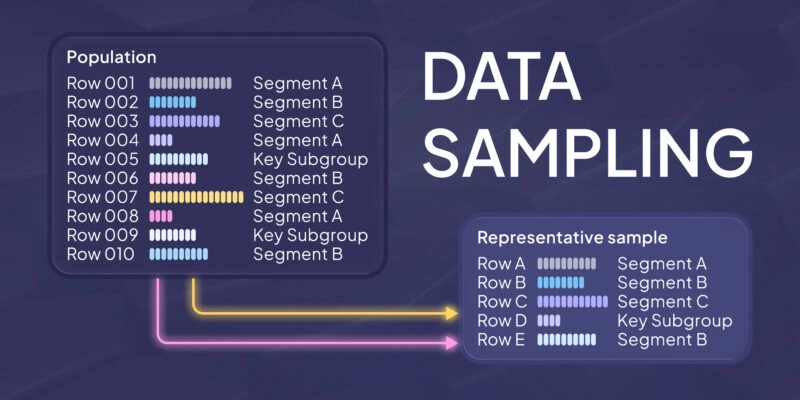
- Transparency: By explicitly listing data sources, demographic composition and collection methods, datasheets make biases visible. The recommendation to describe the dataset’s motivation, composition and collection process encourages creators to examine their sampling practices.
- Reproducibility: A documented collection process allows researchers to replicate studies or compare results across datasets. Without such information, reproduction becomes guesswork.
- Bias remediation: By encouraging dataset updates and maintenance, datasheets allow creators to revise datasets when biases or errors are discovered. Because the maintenance section explicitly asks who is responsible and how updates will be communicated, dataset governance becomes part of standard practice.
Without a datasheet or similar documentation, audits cannot trace the lineage of data, making it difficult to identify sources of bias or errors. By contrast, a well‑maintained datasheet allows internal and external stakeholders to verify that data collection complied with ethical and legal standards.
Comparing Documentation Tools: Datasheets, Data Cards, Model Cards and Nutrition Labels
Datasheets aren’t the only way to document machine learning systems. Over the last few years, other helpful tools have appeared. Knowing how they differ helps organizations pick the right fit.
Data Cards
Google’s Data Cards give a detailed, structured summary of a machine learning dataset. They go beyond traditional documentation by covering 15 key areas. These include a dataset overview, data sensitivity, funding, authorship, motivations, access rules, collection process, sensitive attributes, known uses, and more. A snapshot might show key stats like how many data points exist, class balance, and known biases.
What makes data cards stand out is who they serve. They’re built for everyone: executives, ML engineers, compliance teams. The Google Data Cards Playbook outlines four steps — Ask, Inspect, Answer, and Audit — to guide teams through making the card and checking its quality. This shows that good documentation is a team effort, not a one-time task.
Model Cards
While datasheets and data cards focus on datasets, model cards focus on the models trained on that data. Google introduced the idea, and companies like IBM now use them too. Model cards explain how models perform across different user groups, where they should be used, and where they shouldn’t (huggingface.co). A SAS blog compares them to food labels that help people understand what they’re consuming.
A model card usually includes:
- Data Summary: Like an ingredient list, showing where the data came from and its privacy level.
- Model Summary: Like nutrition info, listing accuracy, performance, and fairness across groups.
- Model Audits: Like a balanced diet plan, reviewing robustness, safety, and long-term reliability.
Model cards also point out good and bad use cases to prevent misuse. In this way, they complement datasheets — one covers the input, the other explains the output.
Dataset Nutrition Labels
Columbia researchers designed Dataset Nutrition Labels to work like food labels. These compact, visual summaries help data scientists get a fast read on data quality. They focus on pre-model evaluation — making it easier to choose the right dataset and avoid problems later (huggingface.co). Like datasheets, they combine stats with insights. But instead of covering the full lifecycle, they zoom in on quality and selection.
Data Statements
In NLP, Emily Bender and Batya Friedman introduced data statements to reduce bias. These statements include details about language variety, speaker demographics, and how the data was gathered. That helps researchers judge whether the data can be used in other settings and understand any ethical risks (aclanthology.org). They’re more focused than datasheets but share the same goals — clarity, context, and fairness.
System Cards
Meta created system cards to explain full AI systems, not just single models (ai.meta.com). These cards show how different models work together and how outputs are merged. They’re built for both everyday users and tech experts. Each system card includes a system overview, usage instructions, component models, and impact details (ai.meta.com). Since many AI tools include multiple models, system cards offer a wider, more complete view.
FactSheets
IBM’s AI FactSheets highlight model governance. They track where the data came from, what the model is for, and how it was tested for bias (greyhoundresearch.com). According to Greyhound Research, these fact sheets travel with the model from training to deployment.
| Tool | Focus Area | Primary Use Case |
|---|---|---|
| Datasheets | Datasets | Documenting dataset creation, content & purpose |
| Data Cards | Datasets | Summarizing dataset lifecycle |
| Model Cards | Trained Models | Explaining model performance & limitations |
| Dataset Nutrition Labels | Datasets | Fast pre-model quality review |
| Data Statements | NLP Datasets | Exposing linguistic bias |
| System Cards | Full AI Systems | Documenting interactions across models |
| AI FactSheets | Model Governance | Supporting audits and compliance |
Real‑World Adoption and Industry Momentum
Documentation frameworks have moved from research into real industry use. Several standout examples show how datasheets and related tools are being adopted at scale:
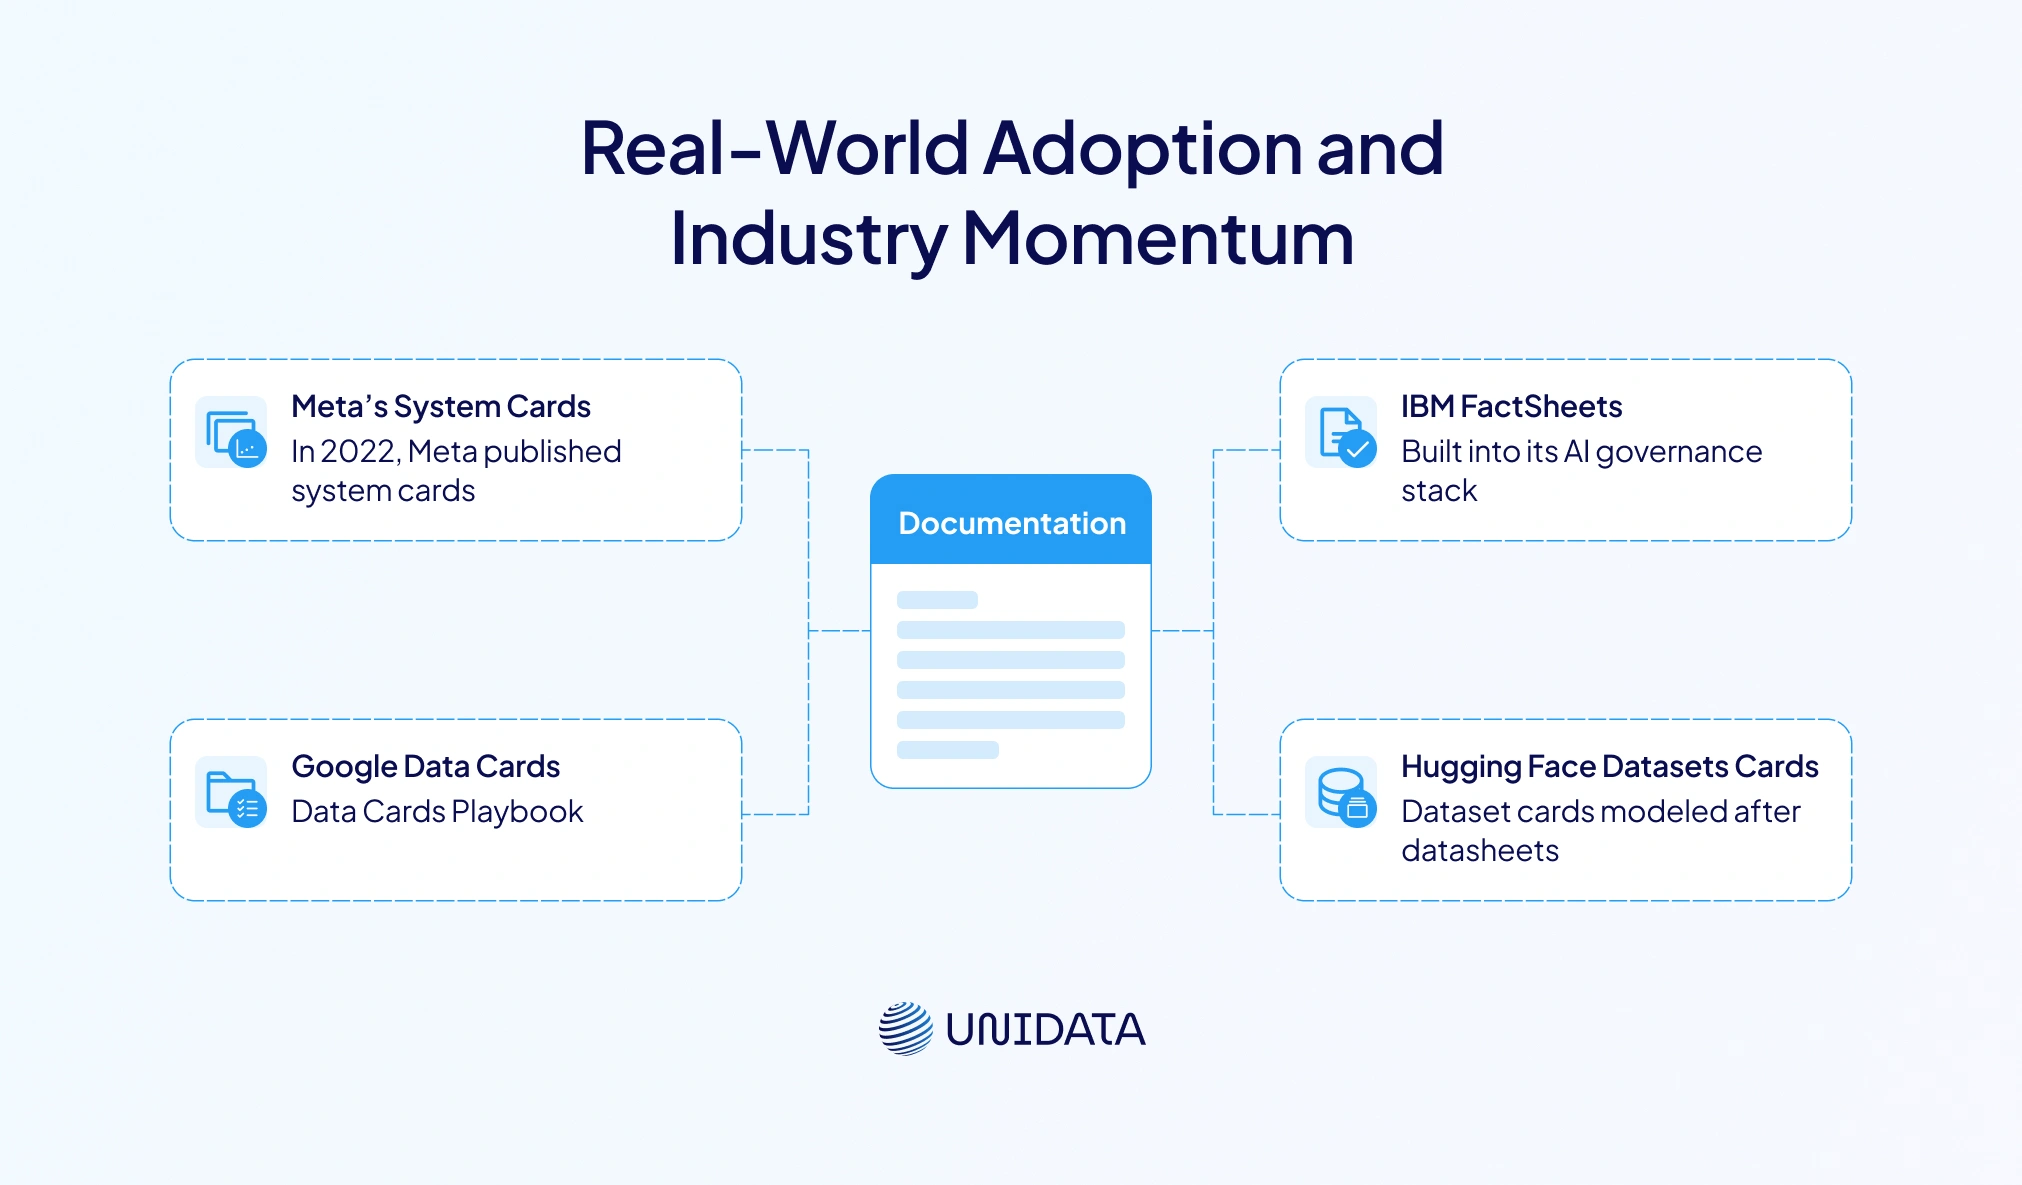
Meta’s System Cards:
In 2022, Meta published 22 system cards covering AI features used across Facebook and Instagram (ai.meta.com). Each card explains how the AI system works, what prediction models it uses, and how users can adjust their experience. This launch shows Meta’s push for transparency — and its effort to make AI easier to understand for both experts and everyday users.
Google Data Cards:
Google created a full Data Cards Playbook to guide teams through dataset documentation. It uses a 15-theme structure that helps teams think beyond specs — to consider goals, ethics, and who is affected (sites.research.google). Many internal Google teams now use this format. Google also offers open-source tools to help automate card creation.
IBM FactSheets:
IBM built FactSheets into its AI governance stack. These documents record where model data came from, what the model is supposed to do, how it performs, and results from bias testing. Because FactSheets stay with the model through its lifecycle, both clients and regulators can easily audit and confirm the model’s compliance.
Hugging Face Datasets:
The Hugging Face Hub asks dataset creators to fill out dataset cards that are modeled after datasheets. These cards include motivation, composition, collection methods, and citations. They help dataset consumers judge quality and pick the right data for their machine learning task.
Together, these examples show a clear trend: structured documentation isn’t a nice-to-have — it’s a must-have. From Big Tech to open-source communities, the machine learning community is aligning around documentation as a standard for transparency and accountability.
How to Create, Populate and Maintain a Datasheet
Creating a datasheet may feel overwhelming at first, but it becomes easier when broken into clear steps. Here's a practical approach for teams:
Identify stakeholders and decision makers.
Talk to data owners, subject-matter experts, legal teams, and ML engineers to get input from all sides. The Data Cards Playbook highlights the need to know who owns each part of the process and how to gather the right information (odsc.com).
Define the dataset’s purpose and scope.
Be clear about why the dataset is being made, who will use it, and what tasks it supports. Include funding details and ethical goals where relevant.
Document composition and collection.
List the types of data, classes, and demographic groups included. Explain how the data was gathered, and what sampling was used. Data source details and provenance should be included, as shown in Google’s Data Cards.
20 Best Face Recognition Datasets for ML in 2026
Learn more
Describe preprocessing and labeling.
Note any cleaning, transformation, or data augmentation steps. Say what rules or tools were followed. For language data, consider using data statements to log dialect, variety, and collection settings (aclanthology.org).
Specify intended uses and limitations.
Clearly state what the dataset is meant for — and what it's not. This helps prevent misuse, just like model cards that include proper and improper use cases.
Plan for maintenance and versioning.
Say how the updates will be shared, and how older versions will be archived. If errors or new biases show up later, document and release updates accordingly.
Address legal and ethical considerations.
Include details on privacy, consent, copyright, and any sensitive content. Refer to ethical codes or external compliance standards where needed.
Review and iterate.
Don’t treat the datasheet as a one-time form. Get feedback, revise it, and run periodic audits to keep it accurate. Use tools like the Audit module in the Data Cards Playbook to check coverage and quality.
Conclusion
Datasheets mark a shift in machine learning — from just performance to transparency and ethics. Like electronics datasheets, they explain why data was collected, what it includes, and how it was gathered. This helps dataset consumers choose wisely, reproduce results, and avoid misuse. The tools are here. What’s needed is follow-through. Embedding documentation into ML workflows builds systems that are fair, traceable, and built on high-quality data.