Climate change isn’t just a news headline — it’s a data problem. From predicting floods to tracking deforestation, high-quality datasets are the backbone of every model tackling environmental and sustainability challenges.
We’ve rounded up the most impactful climate and environmental datasets you can use right now, complete with links, sizes, access, and best-fit tasks.
Choosing the Right Environmental Dataset
Picking data shouldn’t feel like guessing the weather blindfolded. Use this checklist and you’ll land the right set for the job.
Variables & format. What’s inside — NetCDF/GRIB/GeoTIFF? Grids or points? Which fields matter for you: temp, wind, NDVI, SST, emissions, land cover? Any QA flags or uncertainty layers?
Space & time. Do you need 10 m pixels or 1 km grids? Hourly, daily, monthly? Check spatial coverage (global vs. region) and temporal span (recent vs. back to 1850). Alignment saves pain later.
Observations vs. reanalysis. Sensors give you raw reality (plus noise). Reanalyses fill gaps and standardize — but may smooth extremes. Pick the flavor your model expects.
Clouds, gaps & noise. Optical imagery hates clouds. Look for masks, gap-filling, and QC fields. A bit of noise toughens models; bad gaps sink them. Plan for filtering.
Domain fit. Train on what you’ll predict: ag maps for crops, coastal SST for fisheries, urban LCZ for heat risk. Cross-domain leaps need transfer learning and care.
Scale & balance. Big archives feed deep nets. Smaller regions love pretraining + fine-tuning. Watch class imbalance (e.g., rare floods); use weights, sampling, or anomaly methods.
Projections & CRS. Meters or degrees? EPSG codes matter. Reproject once, correctly, and keep metadata tight to avoid warped features and broken joins.
Latency & refresh. Near-real-time for operations, long records for trends. Check update cadence, versioning, and if products get reprocessed.
Ready? Let’s tour the datasets shaping climate and environment in 2025 — starting focused when it helps, and scaling up when it counts.
Reanalysis & Climate Records
1. ERA5 Reanalysis (Copernicus)
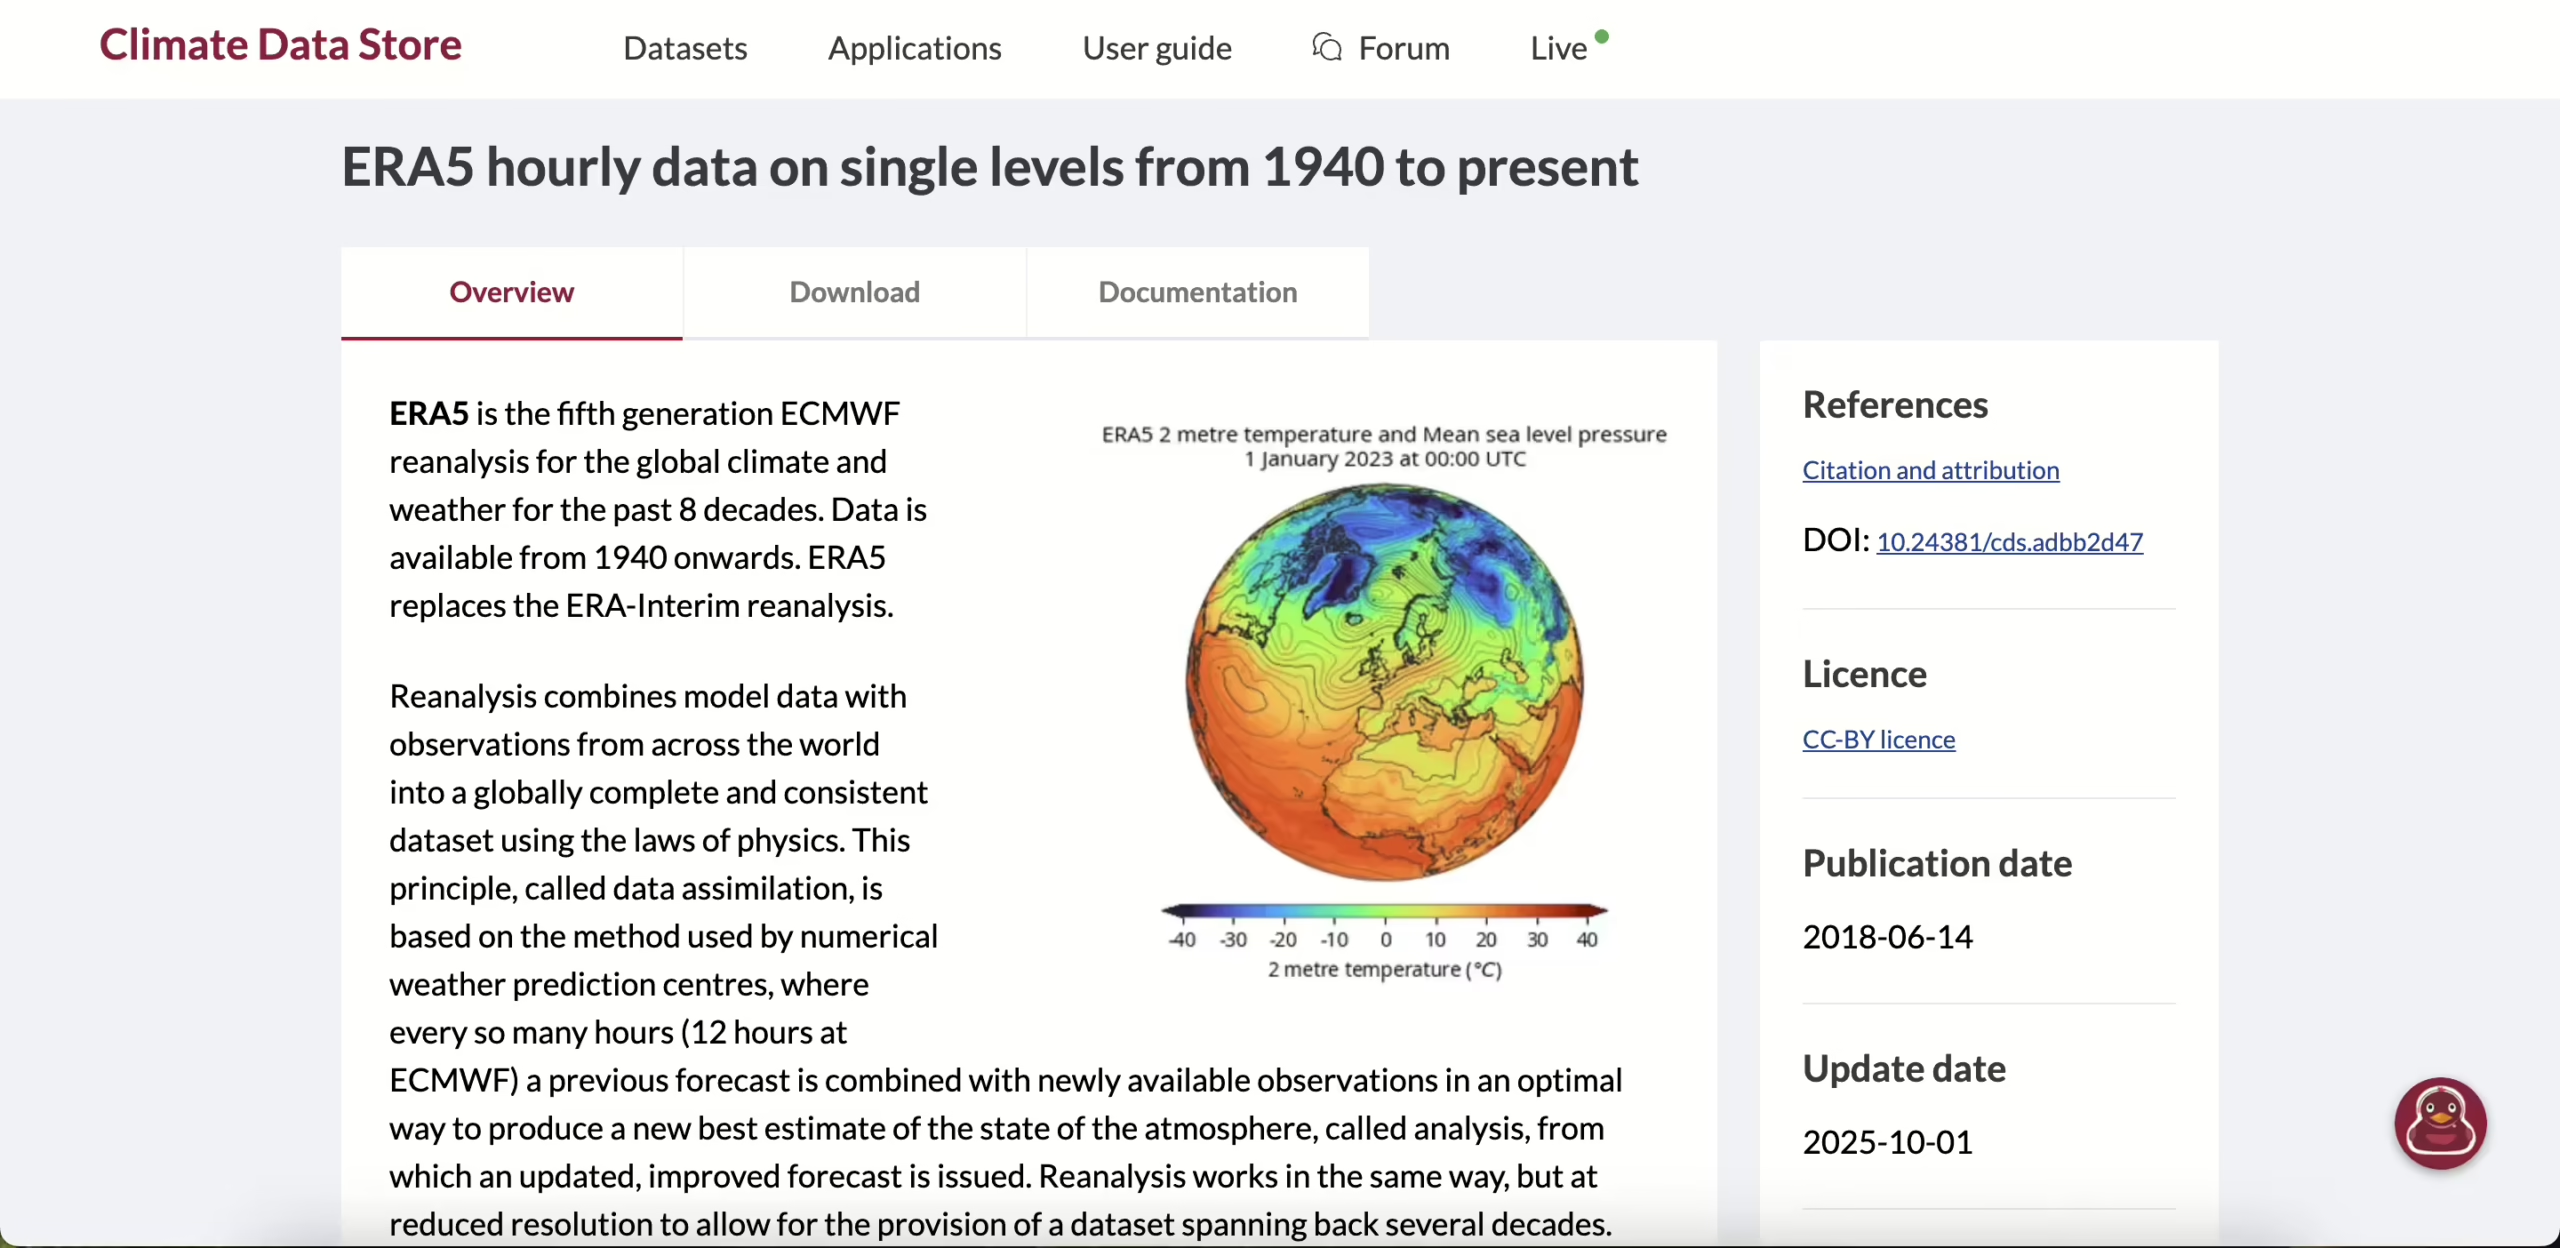
- Volume: ~30 PB, hourly since 1940
- Access: Free (CDS)
- Task Fit: Forecasting, extreme weather, climate modeling
The gold-standard weather rewind with global, hourly fields that actually align. It’s consistent across decades, so joins don’t fight you. Build baselines, backtest models, and trust the stats.
2. Copernicus Climate Data Store
- Volume: 20+ PB across land, ocean, atmosphere
- Access: Free (registration)
- Task Fit: Multi-variable climate modeling, scenarios
One API, many datasets: reanalyses, observations, and projections. Tooling and examples cut setup time to minutes. If your project crosses sectors, this hub keeps it tidy.
3. GHCN (NOAA)
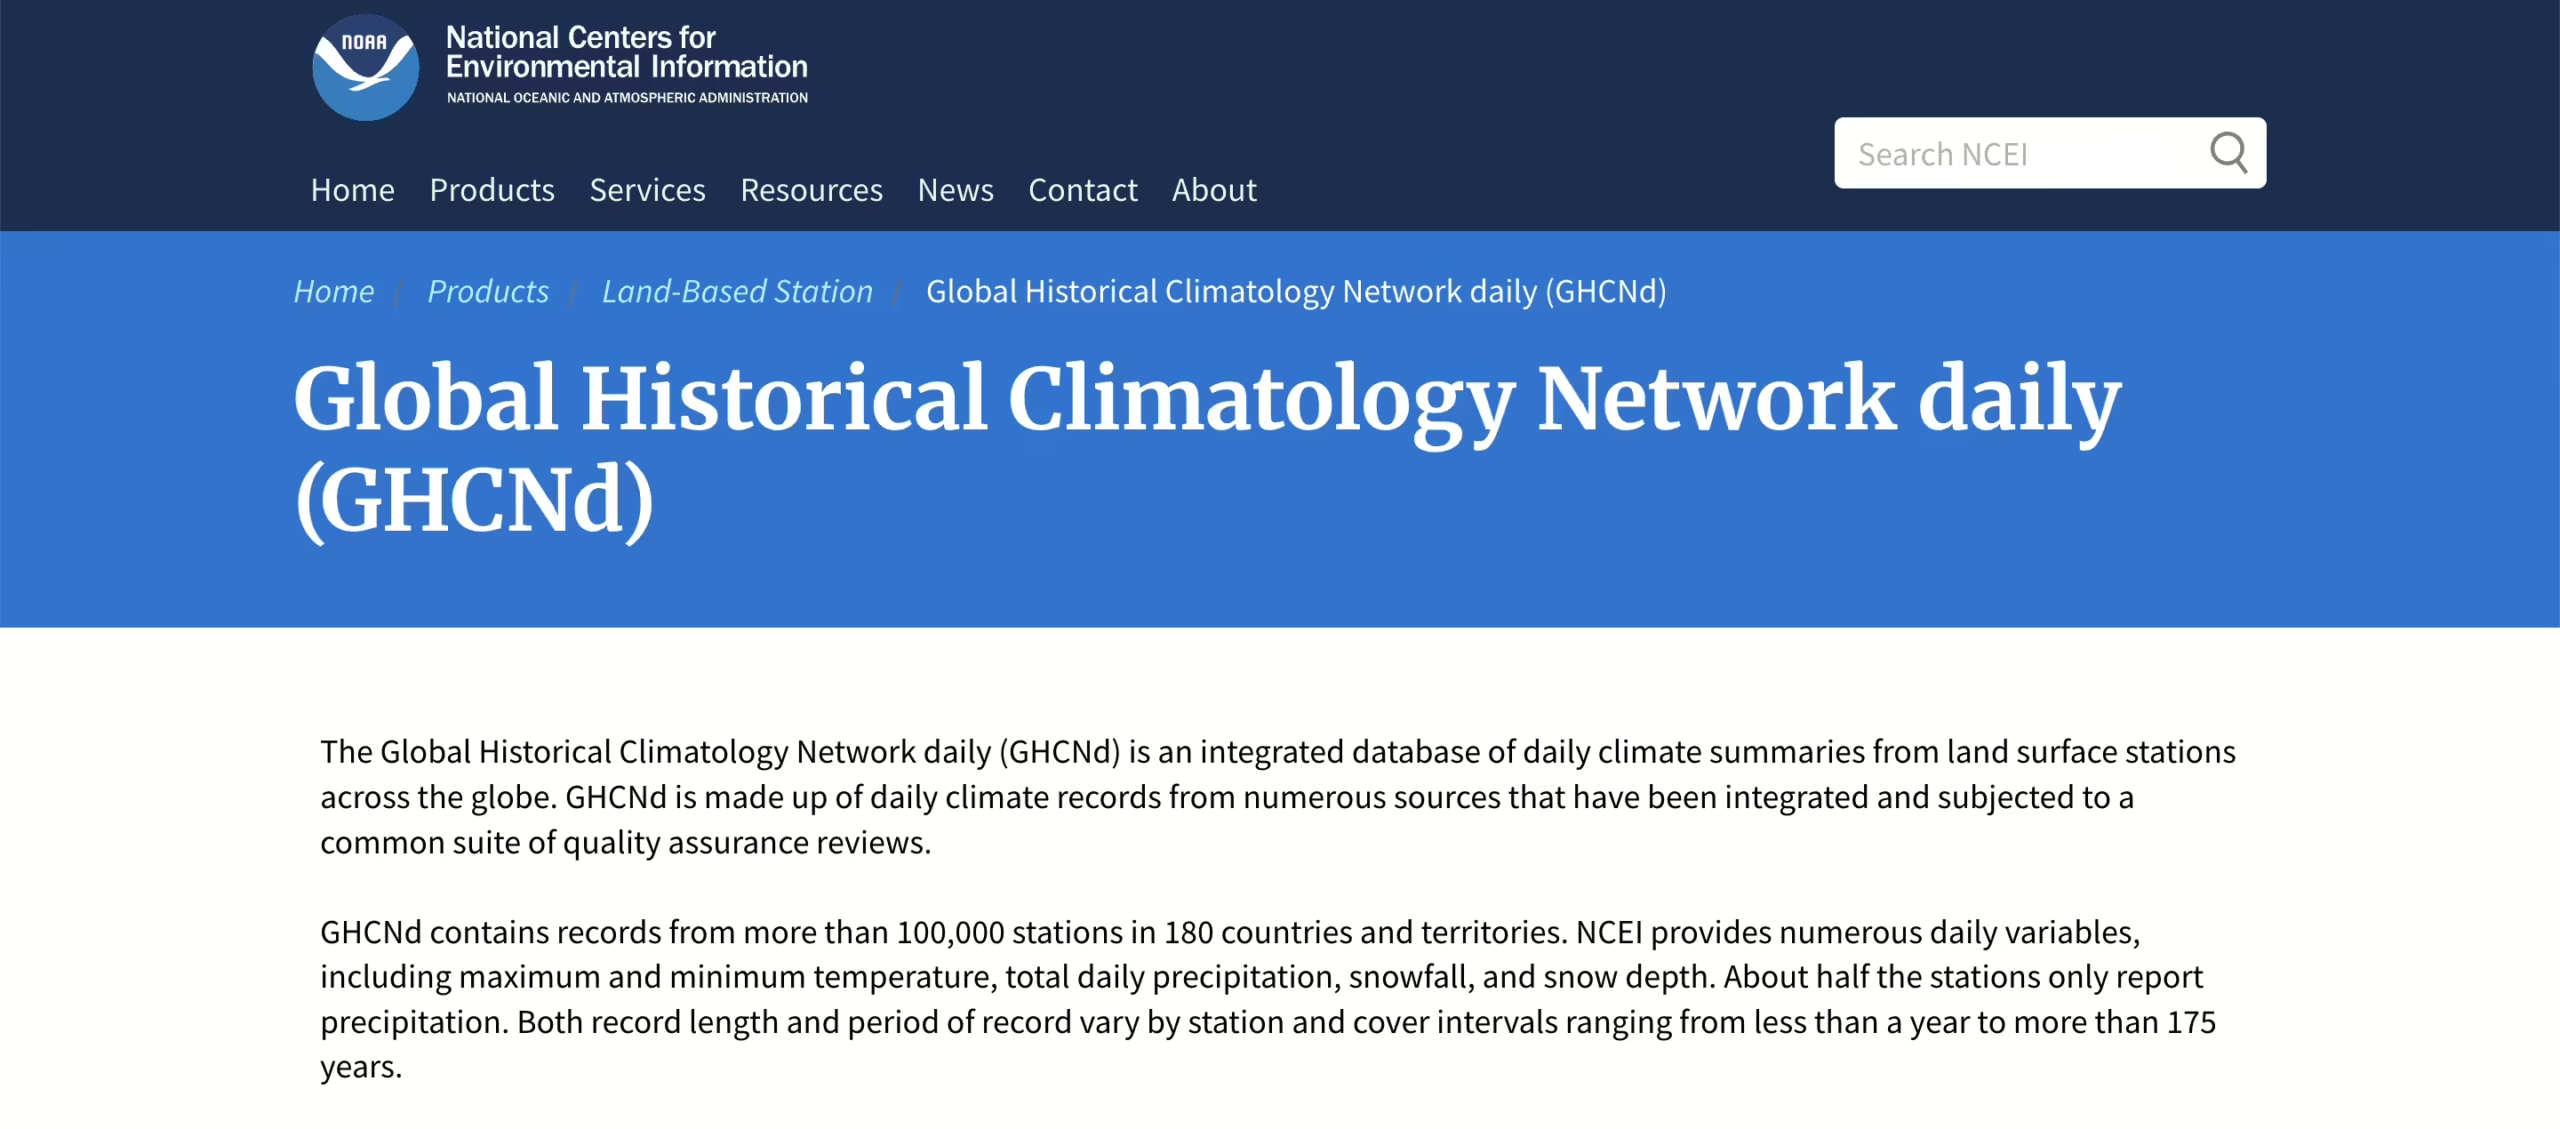
- Volume: 100+ years of daily station records
- Access: Free (CSV/API)
- Task Fit: Trends, anomalies, quality control
The classic surface-station archive with strict QA. Long, dense, and dependable for audits and drift checks. Treat it like your market index for climate time series.
4. WorldClim
- Volume: Global climate grids (~1 km)
- Access: Free
- Task Fit: Ecology, species distribution, downscaling
Clean bioclim variables that “just work” out of the box. Popular in ecology because it saves preprocessing. Great for habitat maps and quick niche models.
5. Berkeley Earth
- Volume: 1.6B+ temperature reports
- Access: Free (CSV)
- Task Fit: Trend analysis, bias checks, visualization
Independent global temps with clear methods and easy downloads. Perfect for charts and sanity checks against NASA/NOAA. When you need credibility fast, start here.
6. HadCRUT (Met Office Hadley Centre)
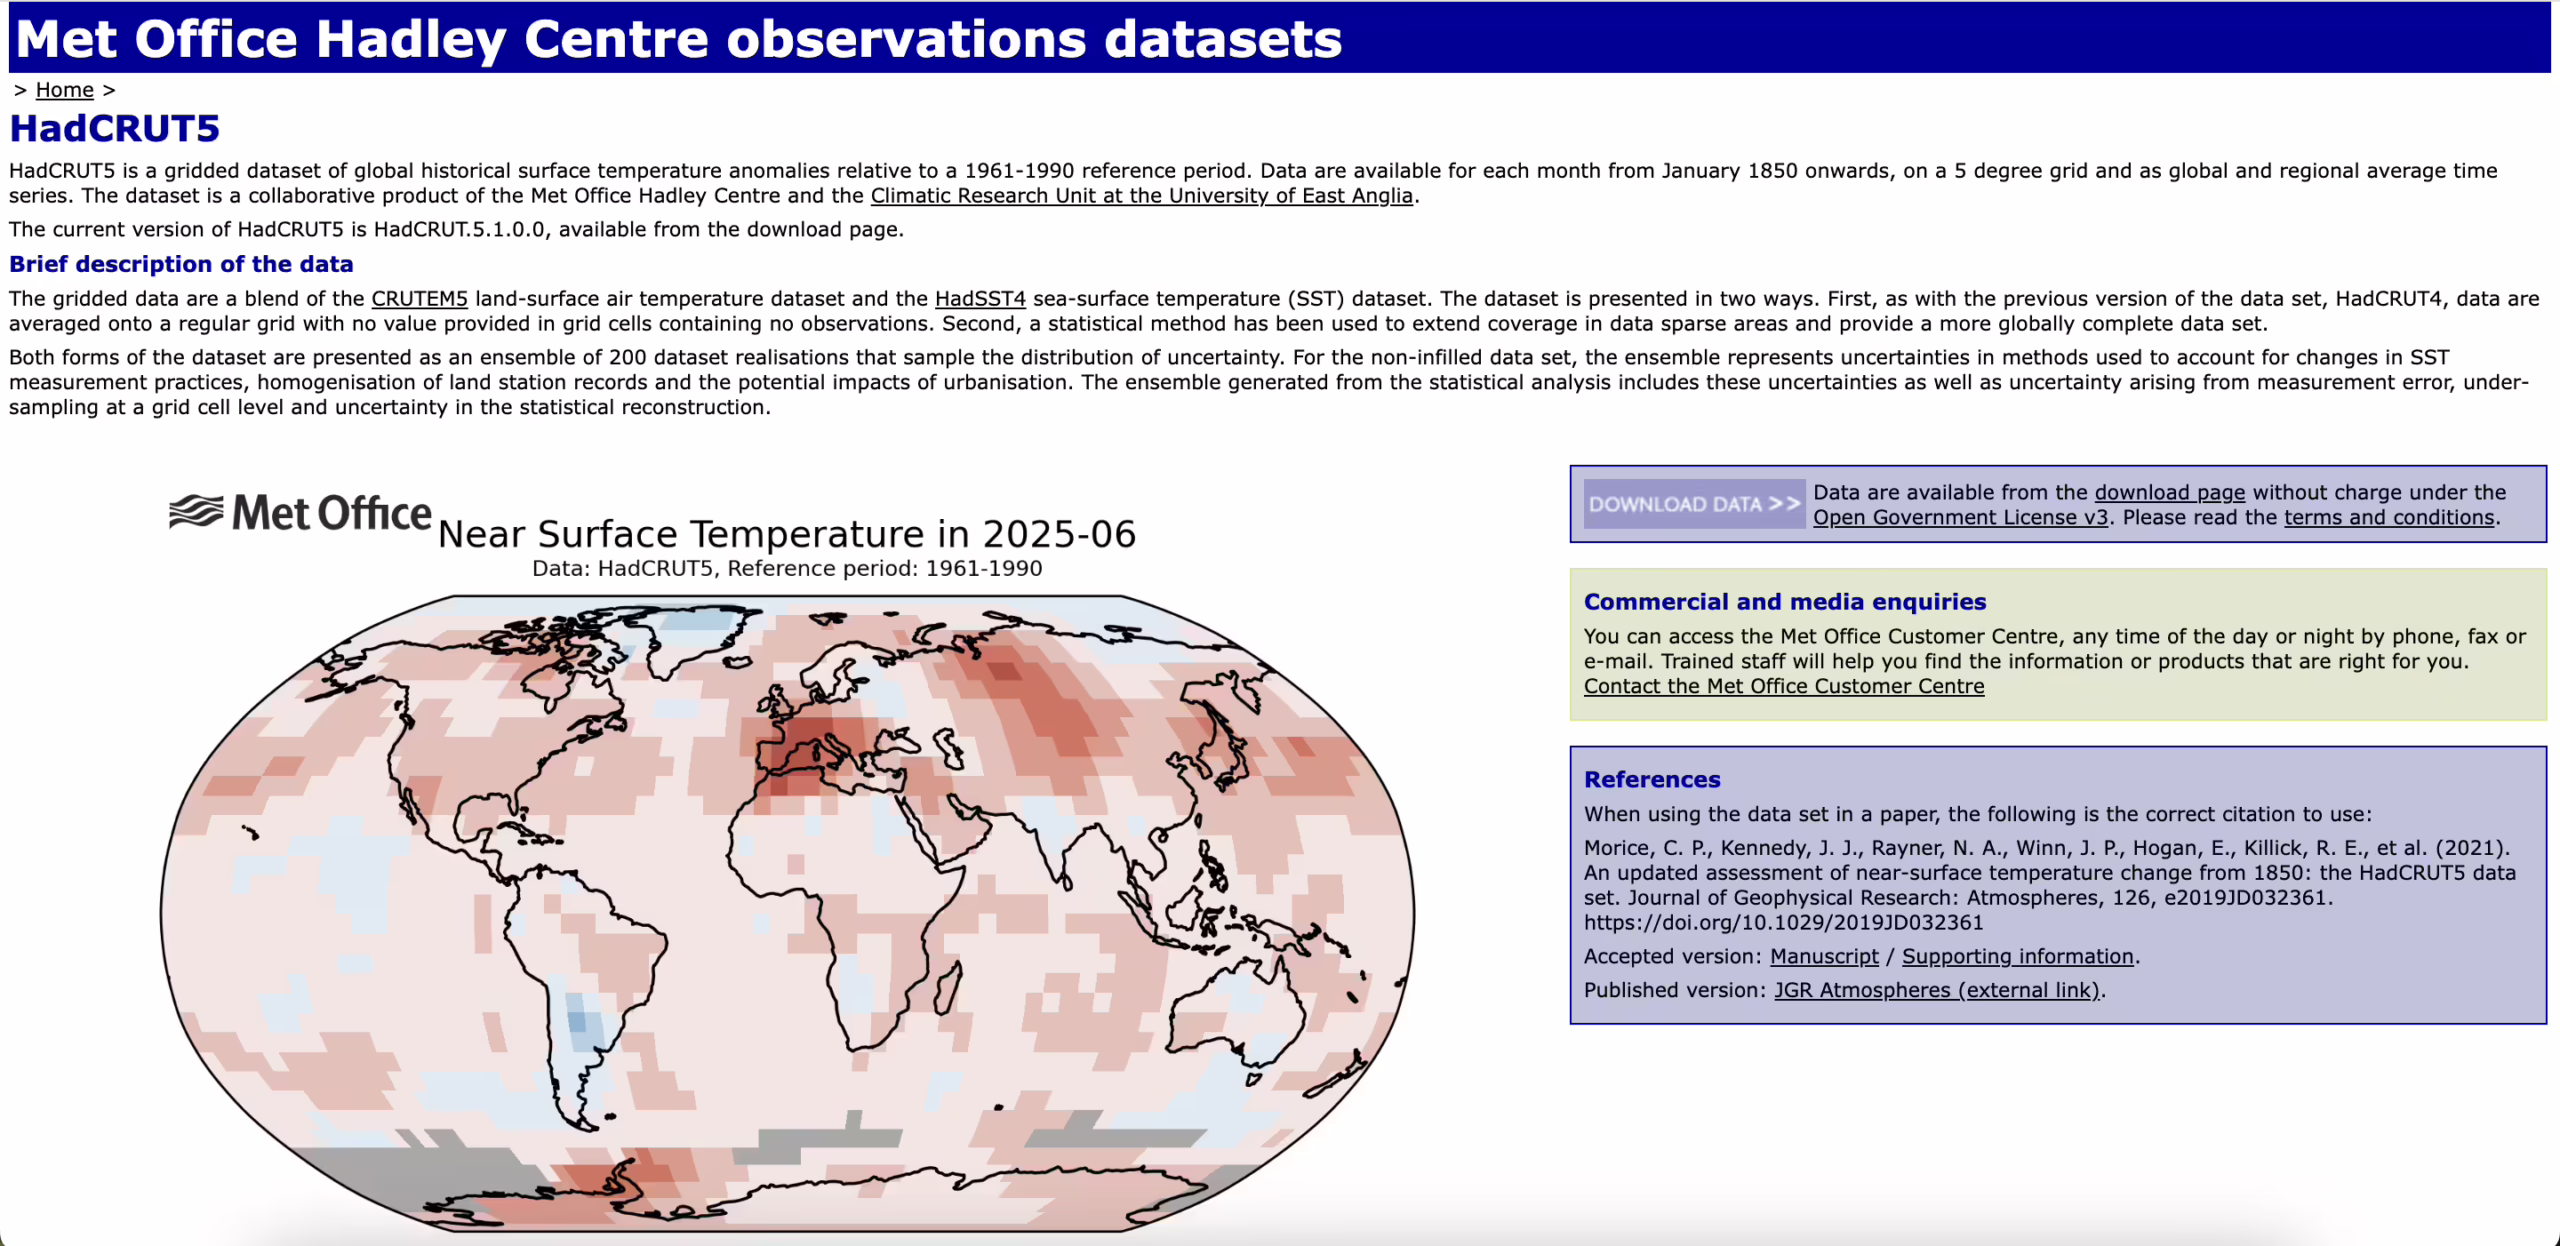
- Volume: Monthly surface temps since 1850
- Access: Free
- Task Fit: Long-term anomalies, attribution
The historical series behind many IPCC figures. Conservative methods, consistent treatment, and broad trust. Ideal for the big-picture warming story.
Remote Sensing & Land Use
7. MODIS Land Products
- Volume: Global daily data since 2000
- Access: Free (NASA LP DAAC)
- Task Fit: Fire detection, NDVI/vegetation, land cover
The satellite workhorse: frequent revisits, stable products, huge coverage. Great for seasonal signals and disturbance maps. When you need throughput over couture, use MODIS.
8. Sentinel-2 Imagery
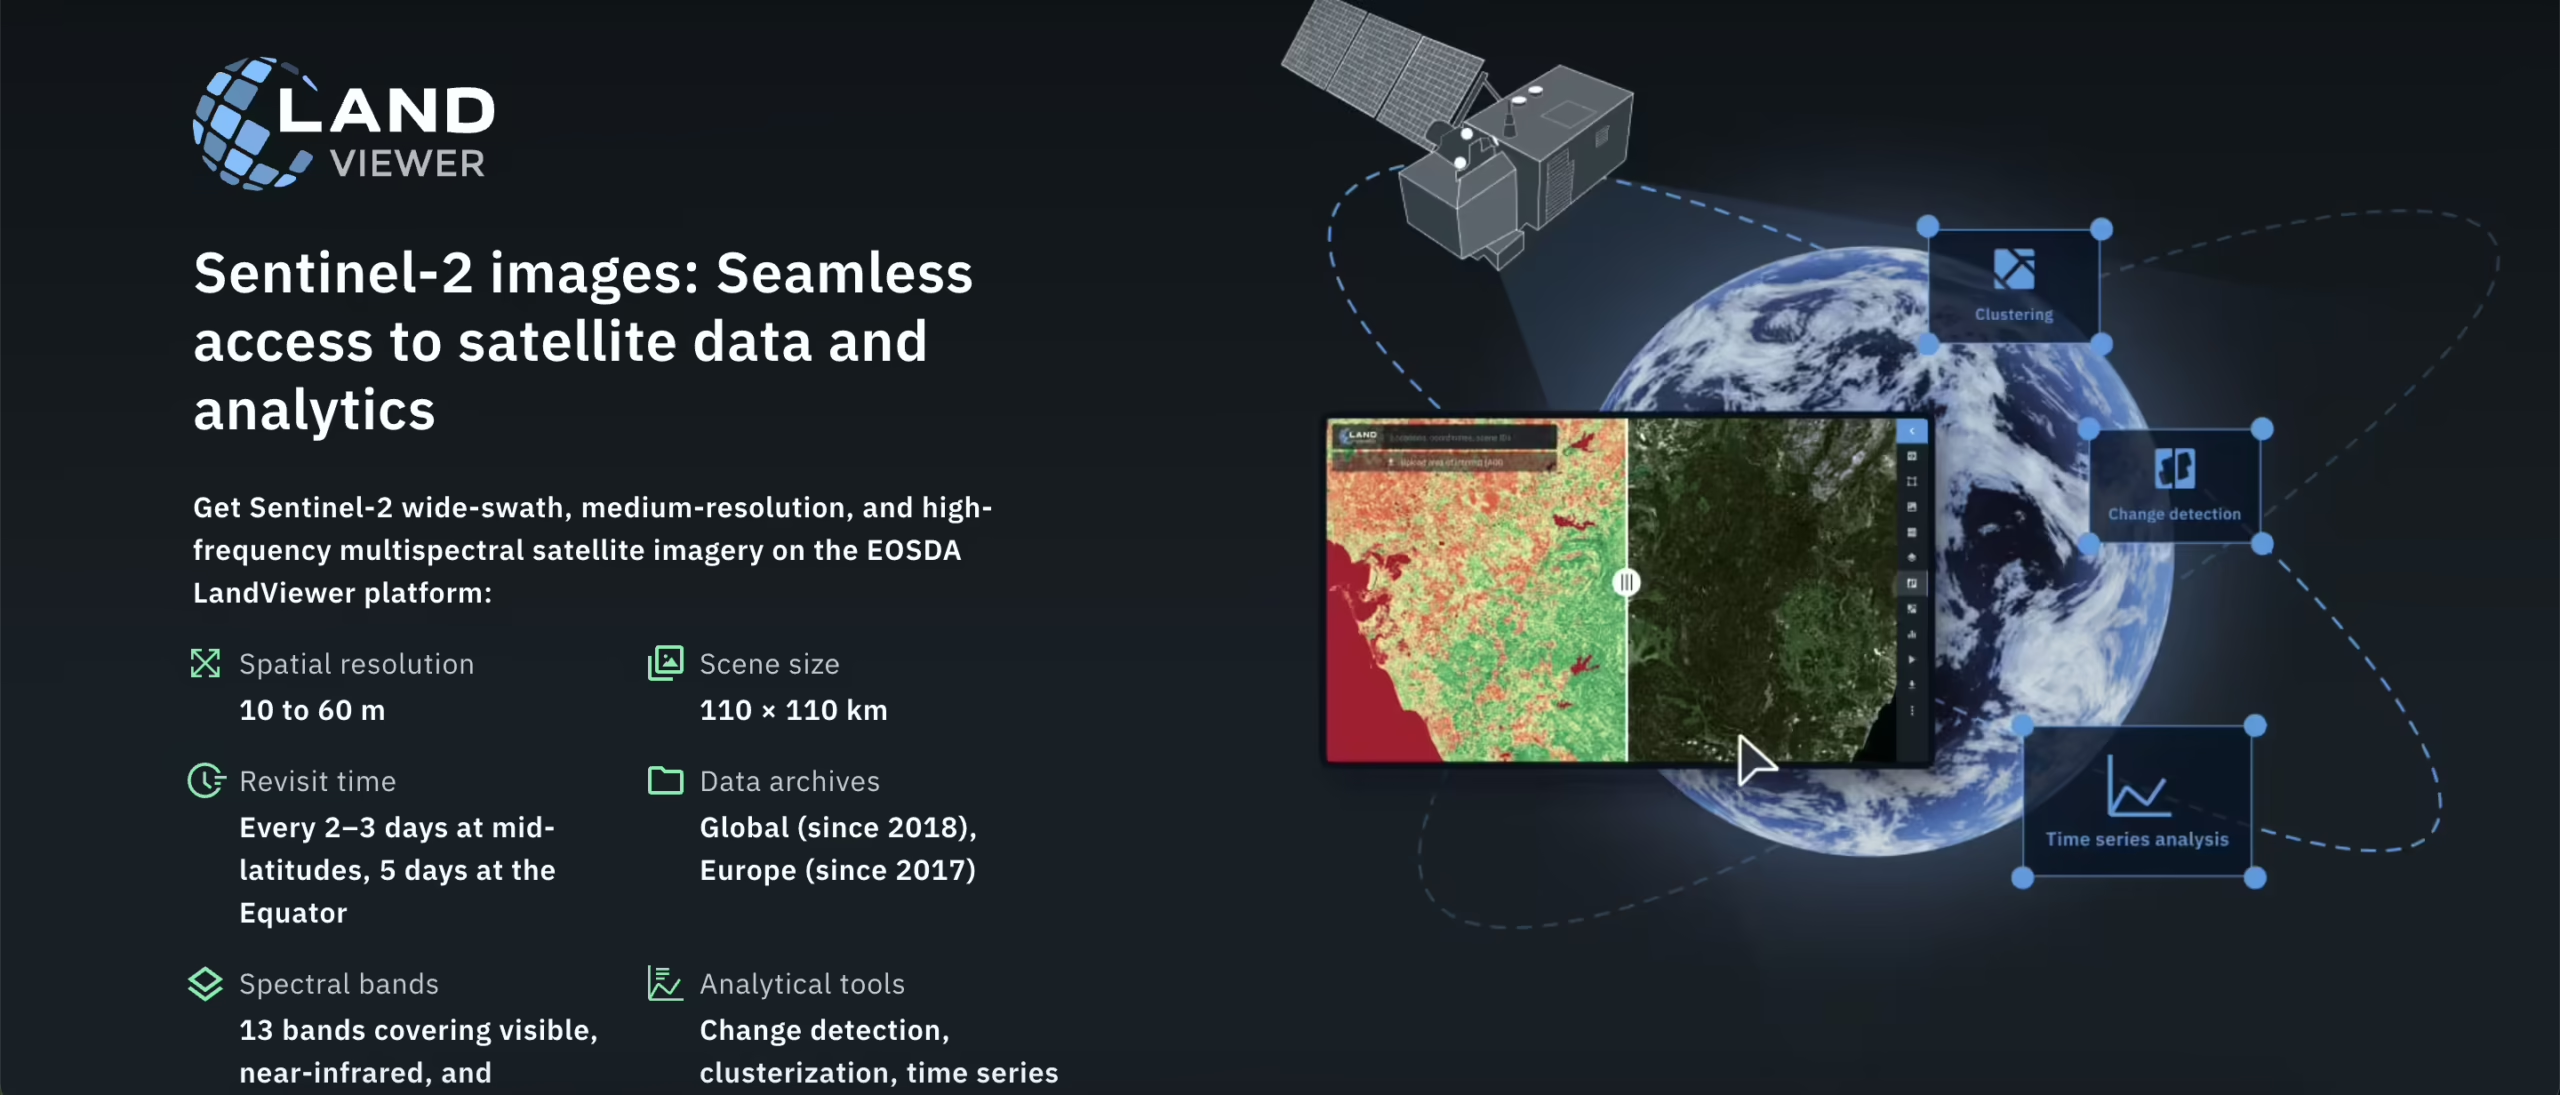
- Volume: ~1 TB/day, 10–60 m multispectral
- Access: Free (Copernicus)
- Task Fit: Land cover, crop monitoring, disaster mapping
Crisp pixels plus rich bands for vegetation, water, and cities. Cloud masks play nice with ML pipelines. For classification and segmentation, it’s your everyday driver.
9. Global Forest Change (Hansen)
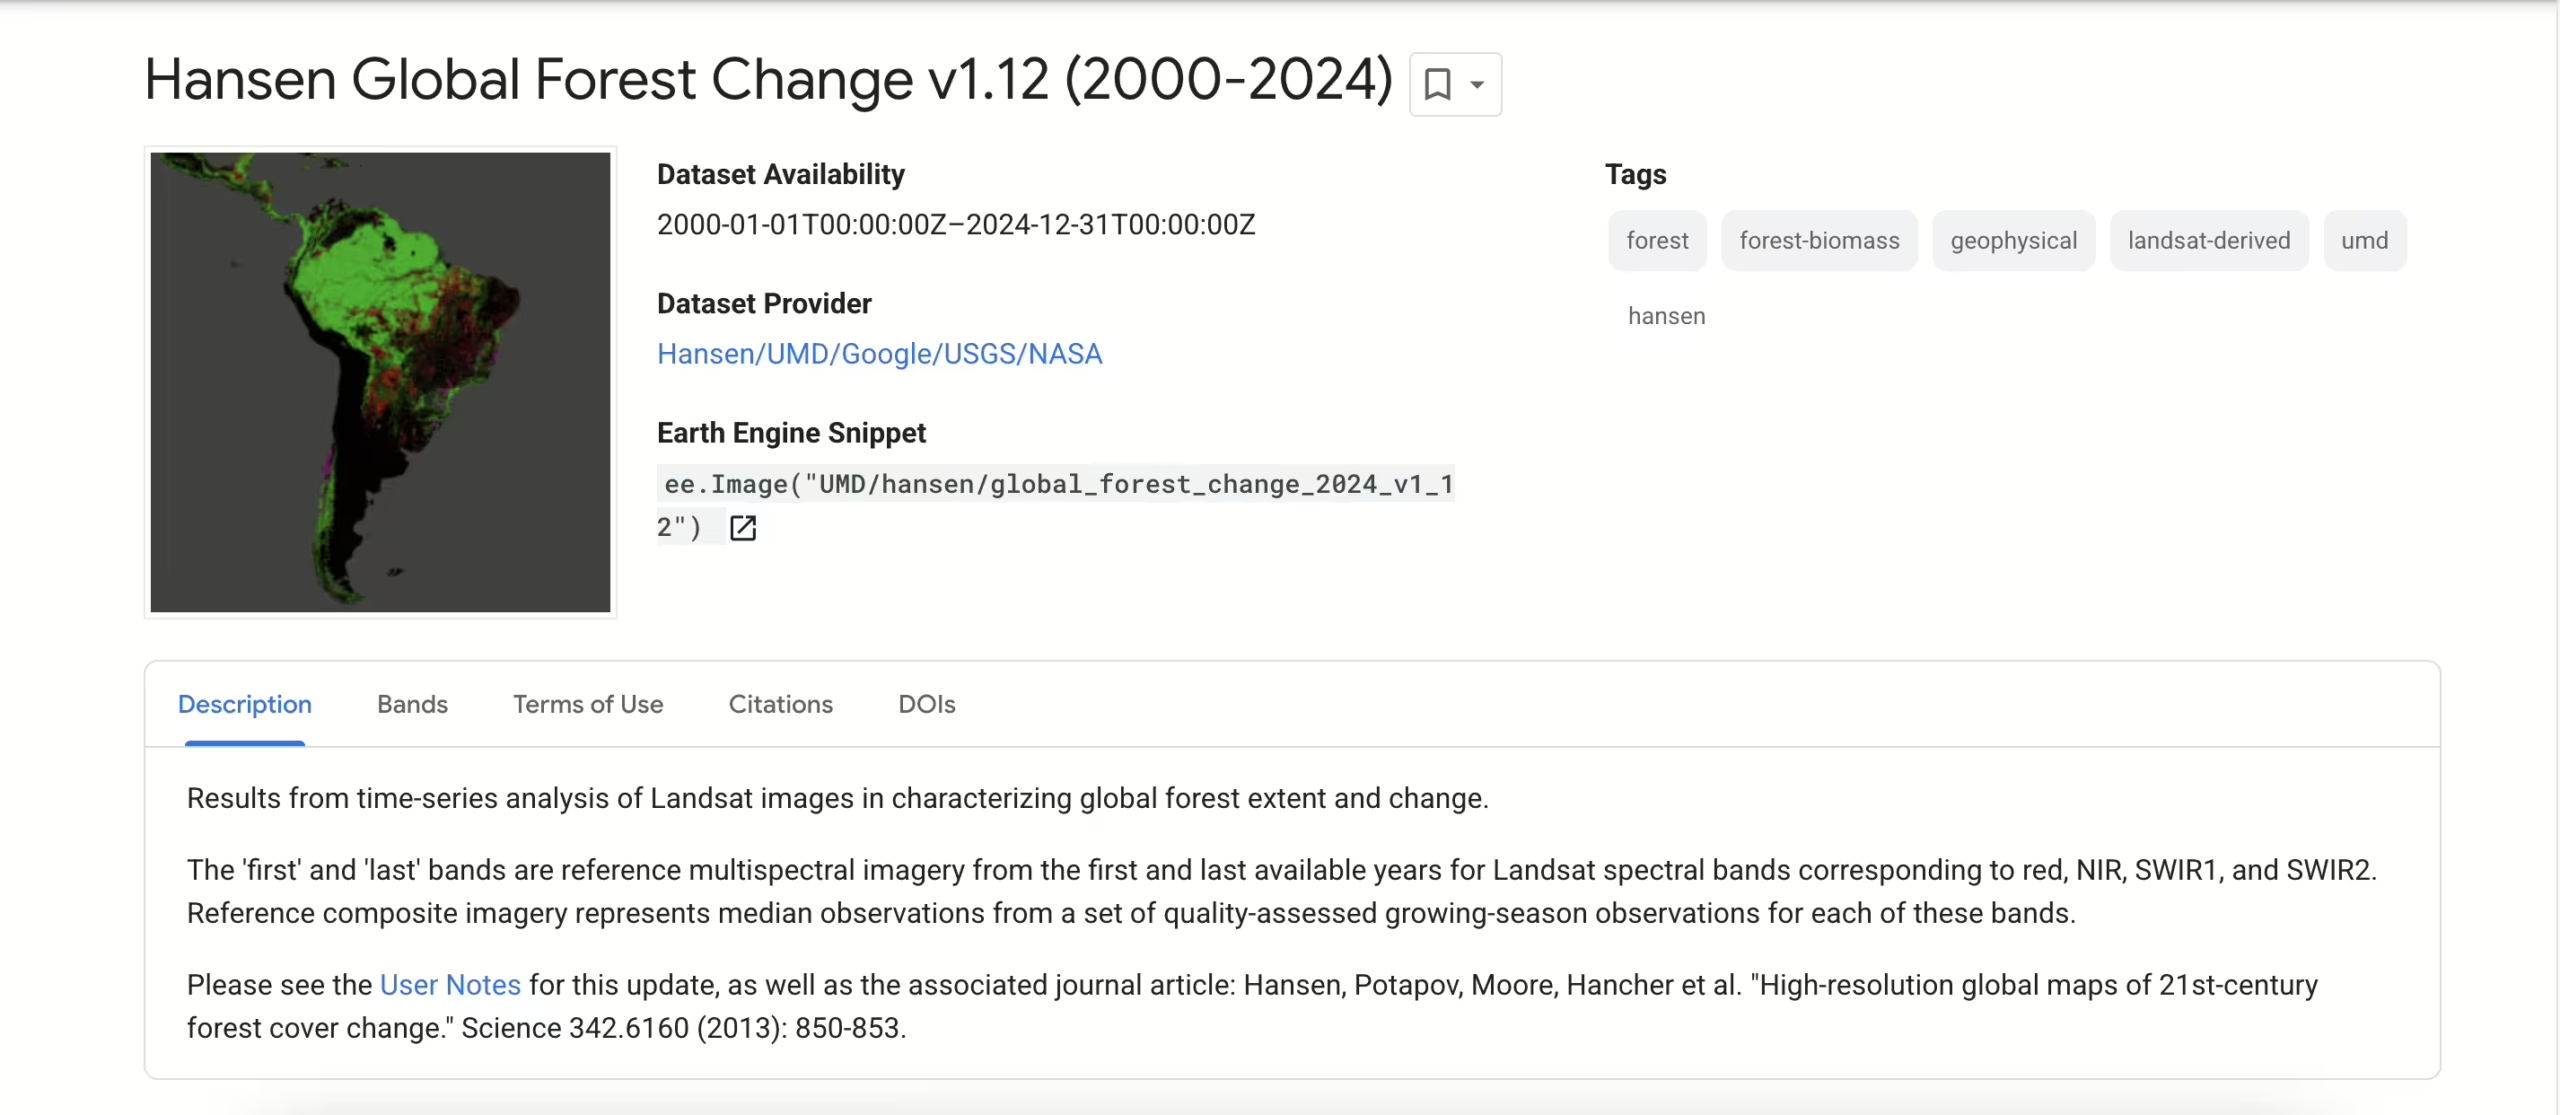
- Volume: 30 m annual forest loss/gain, 2000–present
- Access: Free (Google Earth Engine)
- Task Fit: Deforestation, carbon accounting, compliance
Pixel-level forest change, globally and annually. It’s fast to query and easy to explain to stakeholders. If trees vanish, this dataset tells you where, when, and how fast.
10. Cropland Data Layer (USDA)
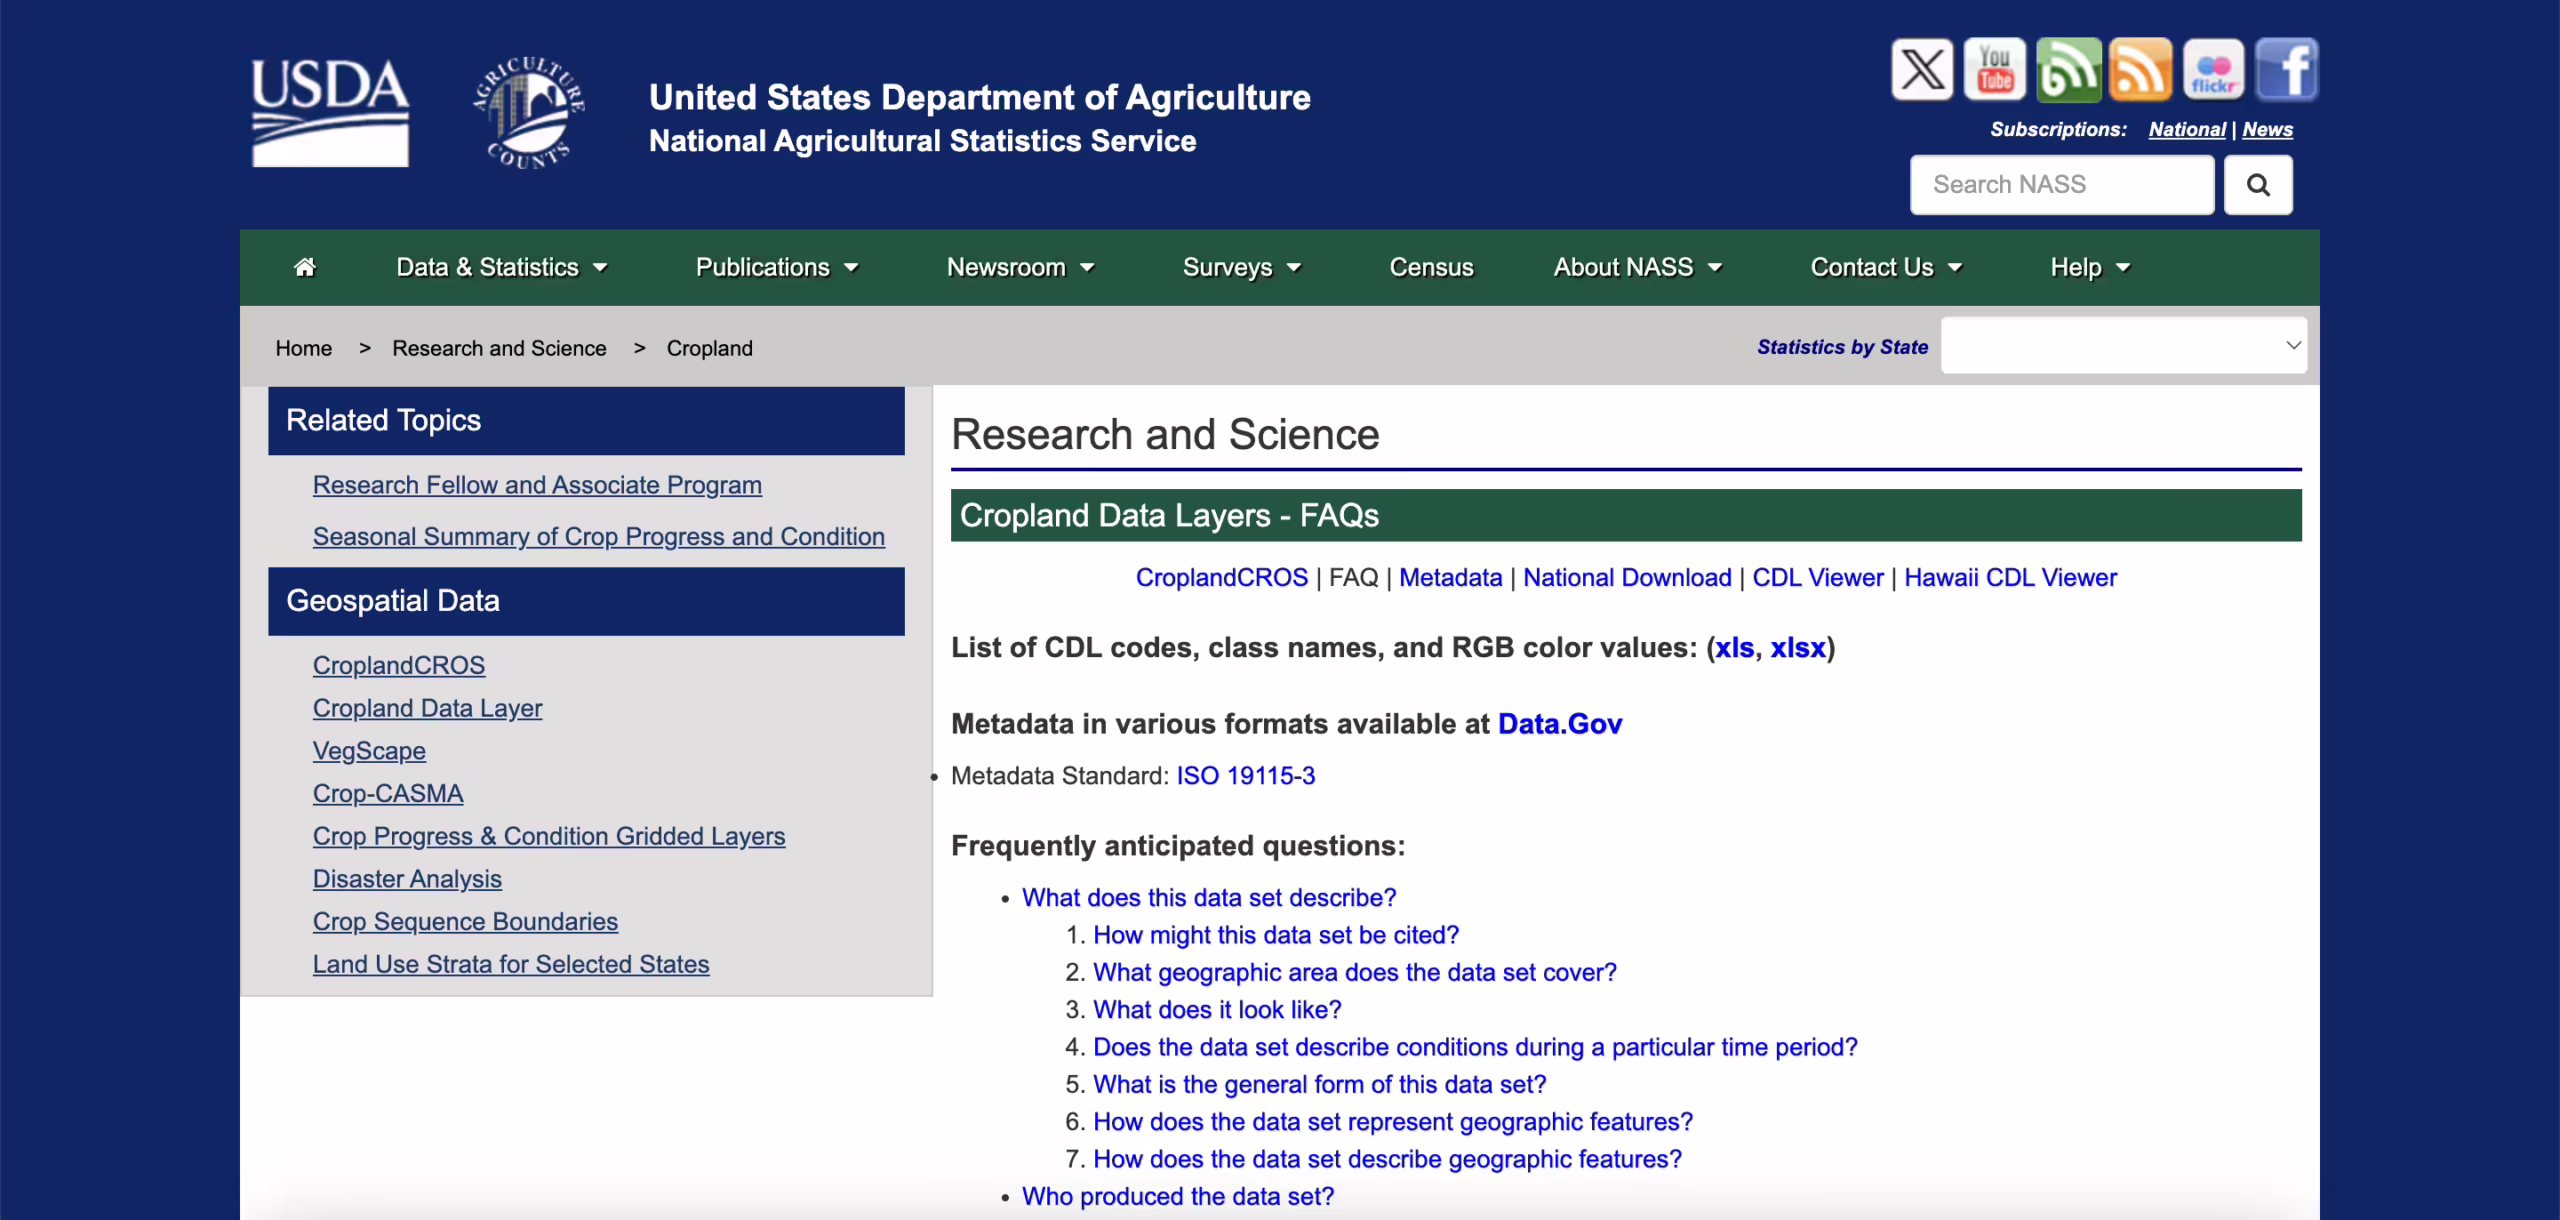
- Volume: Annual U.S. cropland maps since 2008
- Access: Free (USDA NASS)
- Task Fit: Crop classification, yield modeling, ag monitoring
Field-level crop labels refreshed each year. Use it for ground truth or to fuse with Sentinel-2. Robust, practical, and beloved in ag-AI.
11. PRISM Climate (USA)
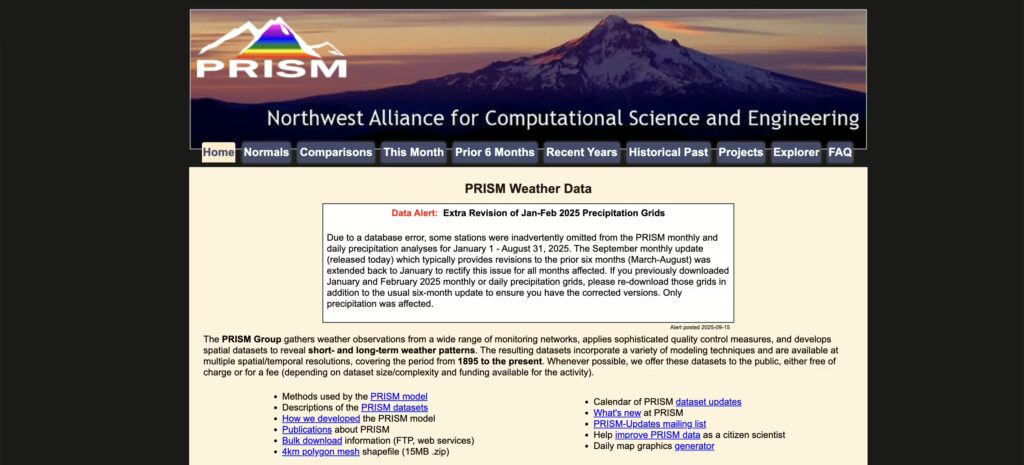
- Volume: ~4 km grids, 1895–present (U.S.)
- Access: Free
- Task Fit: Regional modeling, interpolation, hydrology
High-quality gridded fields built from dense station networks. Cleaner inputs mean tighter regional fits. If your use case is U.S. and precise, PRISM helps.
12. SAGE Global Land-Use Datasets
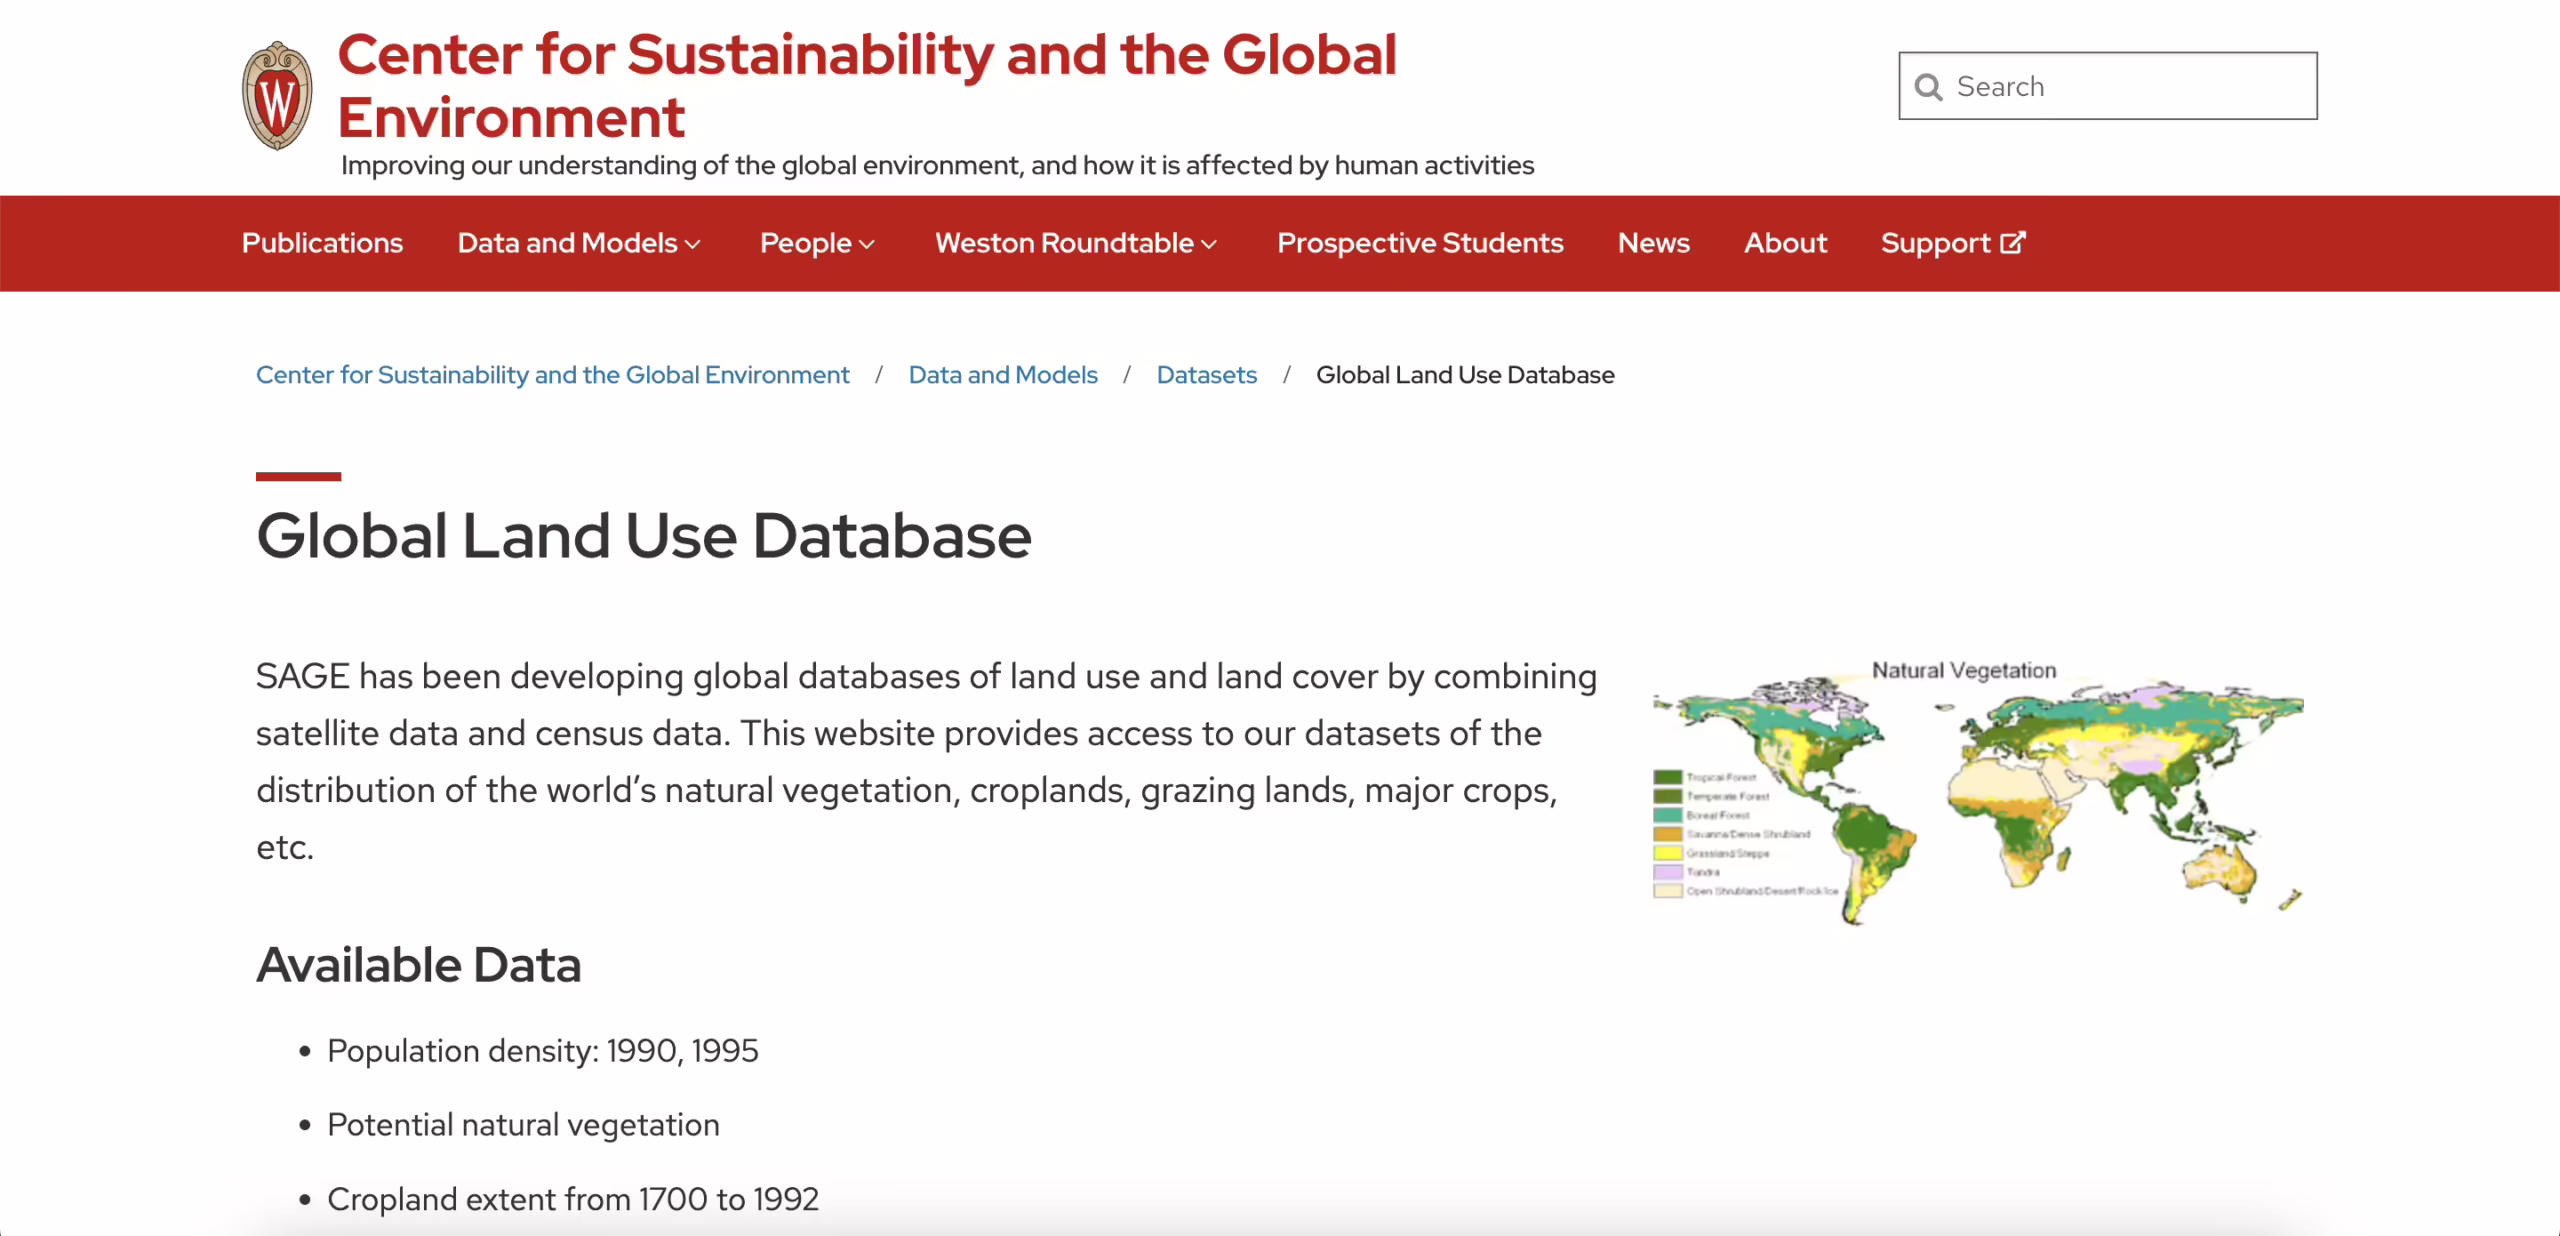
- Volume: Multi-decadal global cropland & land use
- Access: Free
- Task Fit: Land-cover change, ecosystem services, LULC drivers
A long lens on human land pressure. Perfect for coupling with biodiversity or carbon models. Turn “anthropogenic impact” into measurable features.
Ocean, Atmosphere & Emissions
13. ICOADS
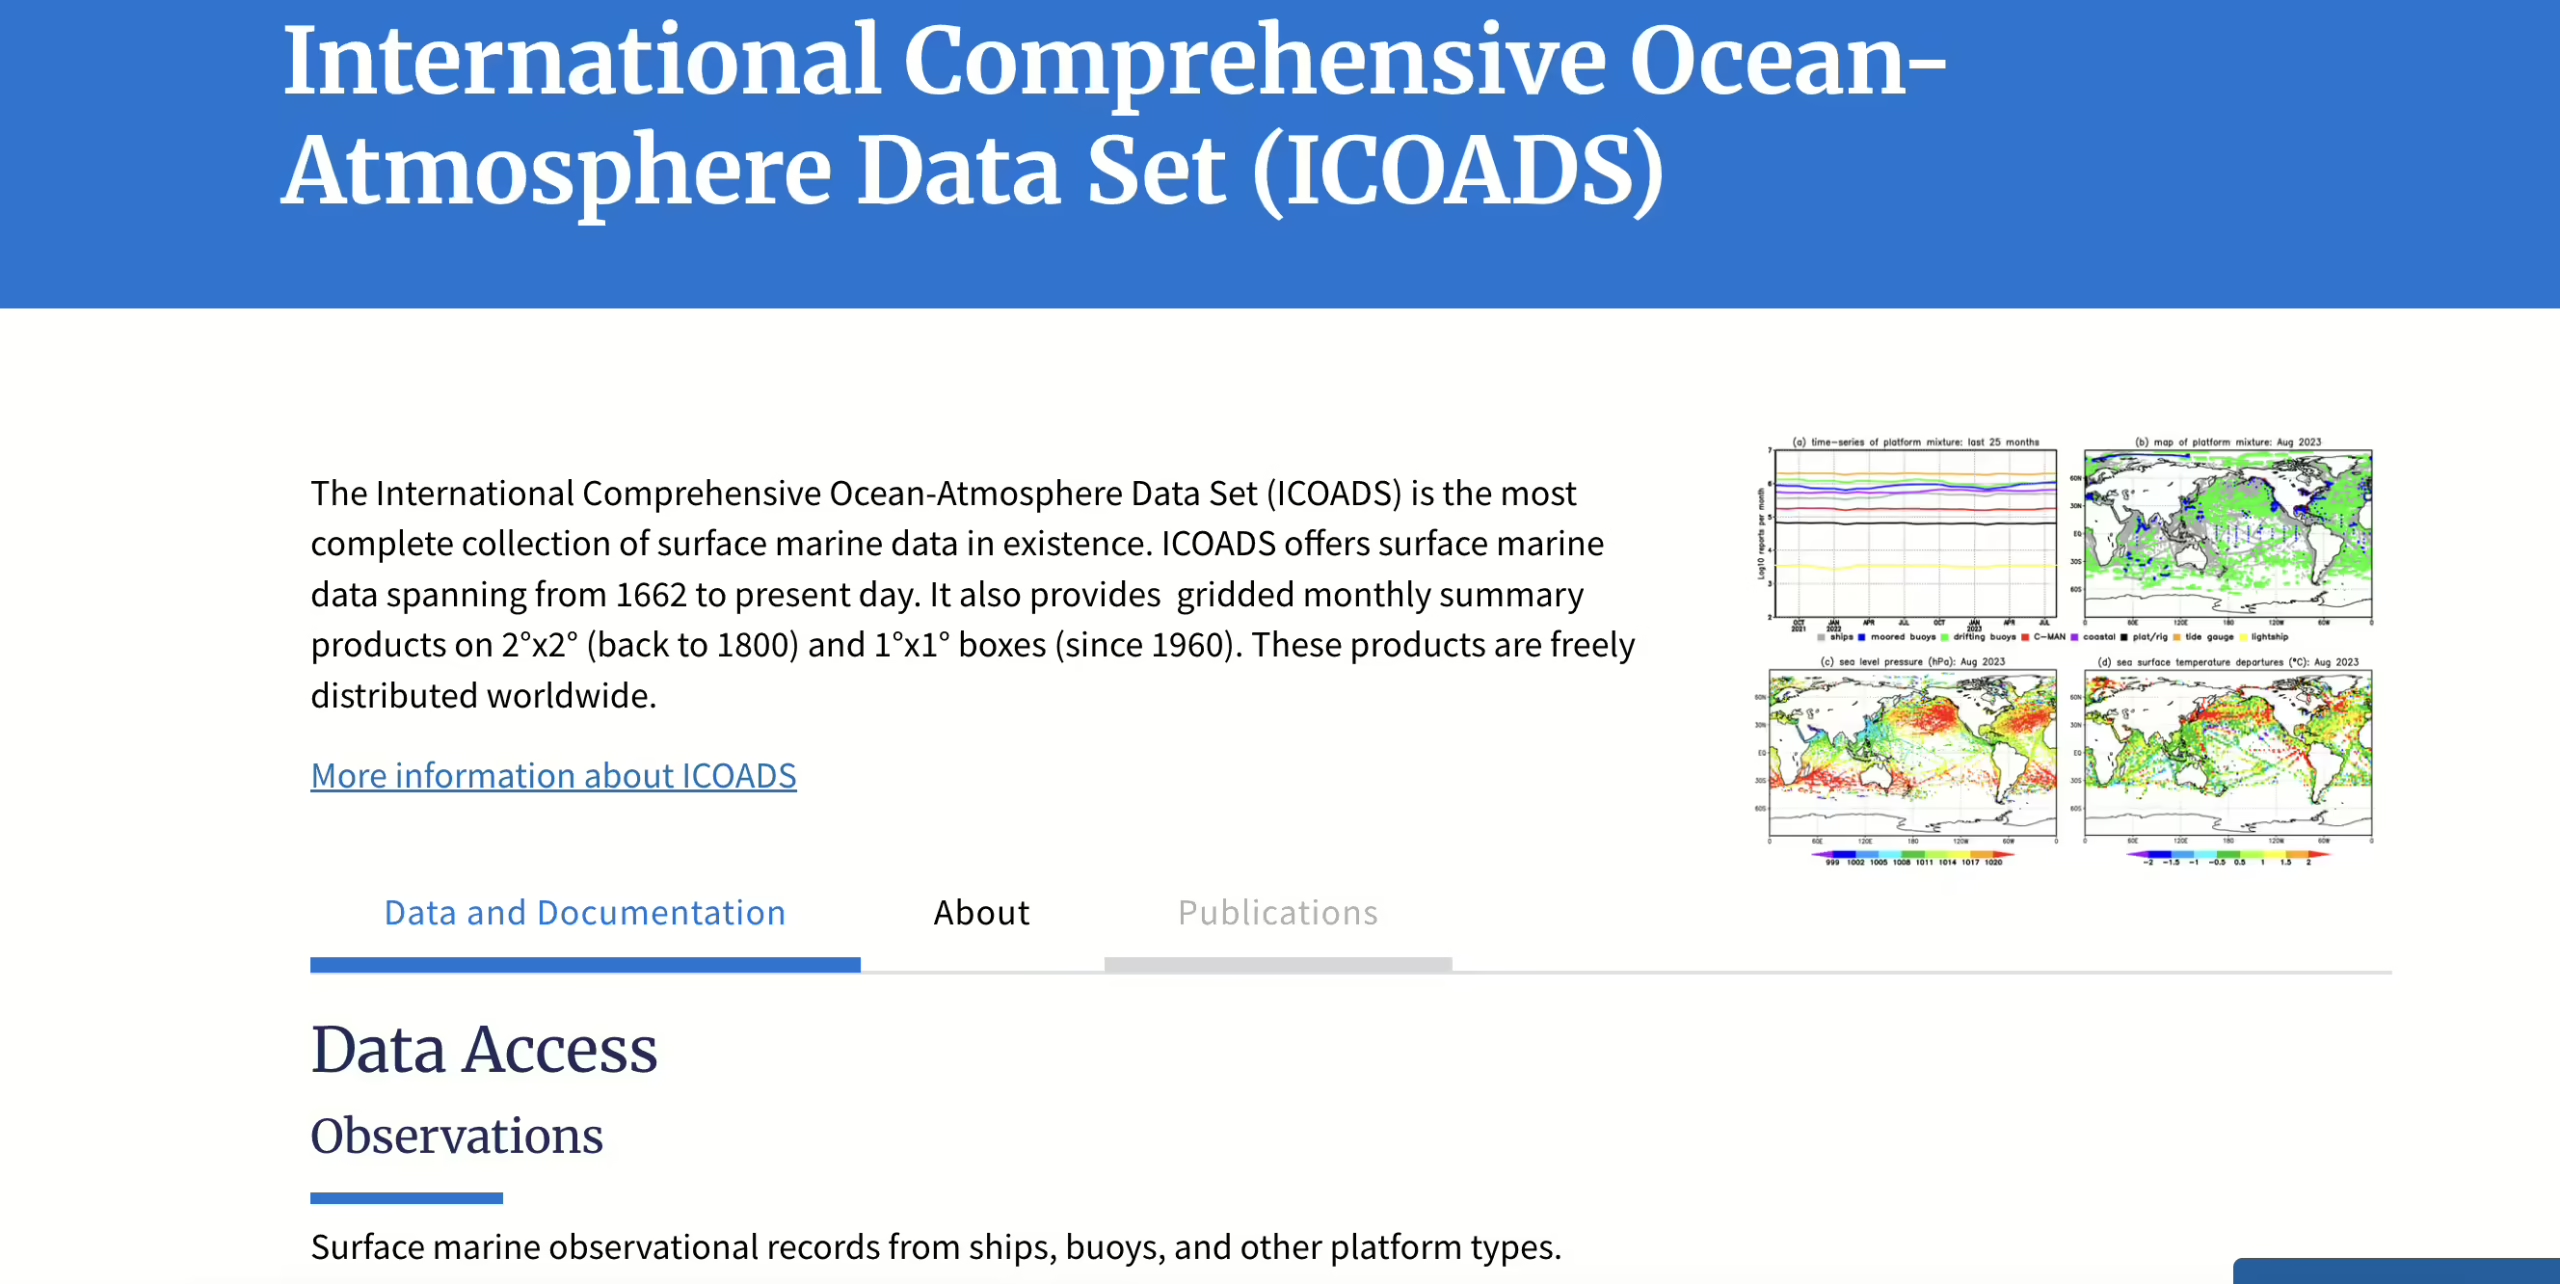
- Volume: 300M+ ship & buoy observations since 1662
- Access: Free
- Task Fit: SST, winds, marine climate, validation
The oldest ocean–atmosphere record in the books. Great for SST, winds, and coastal checks. Validate reanalyses and marine models without guesswork.
14. EDGAR (EU JRC)
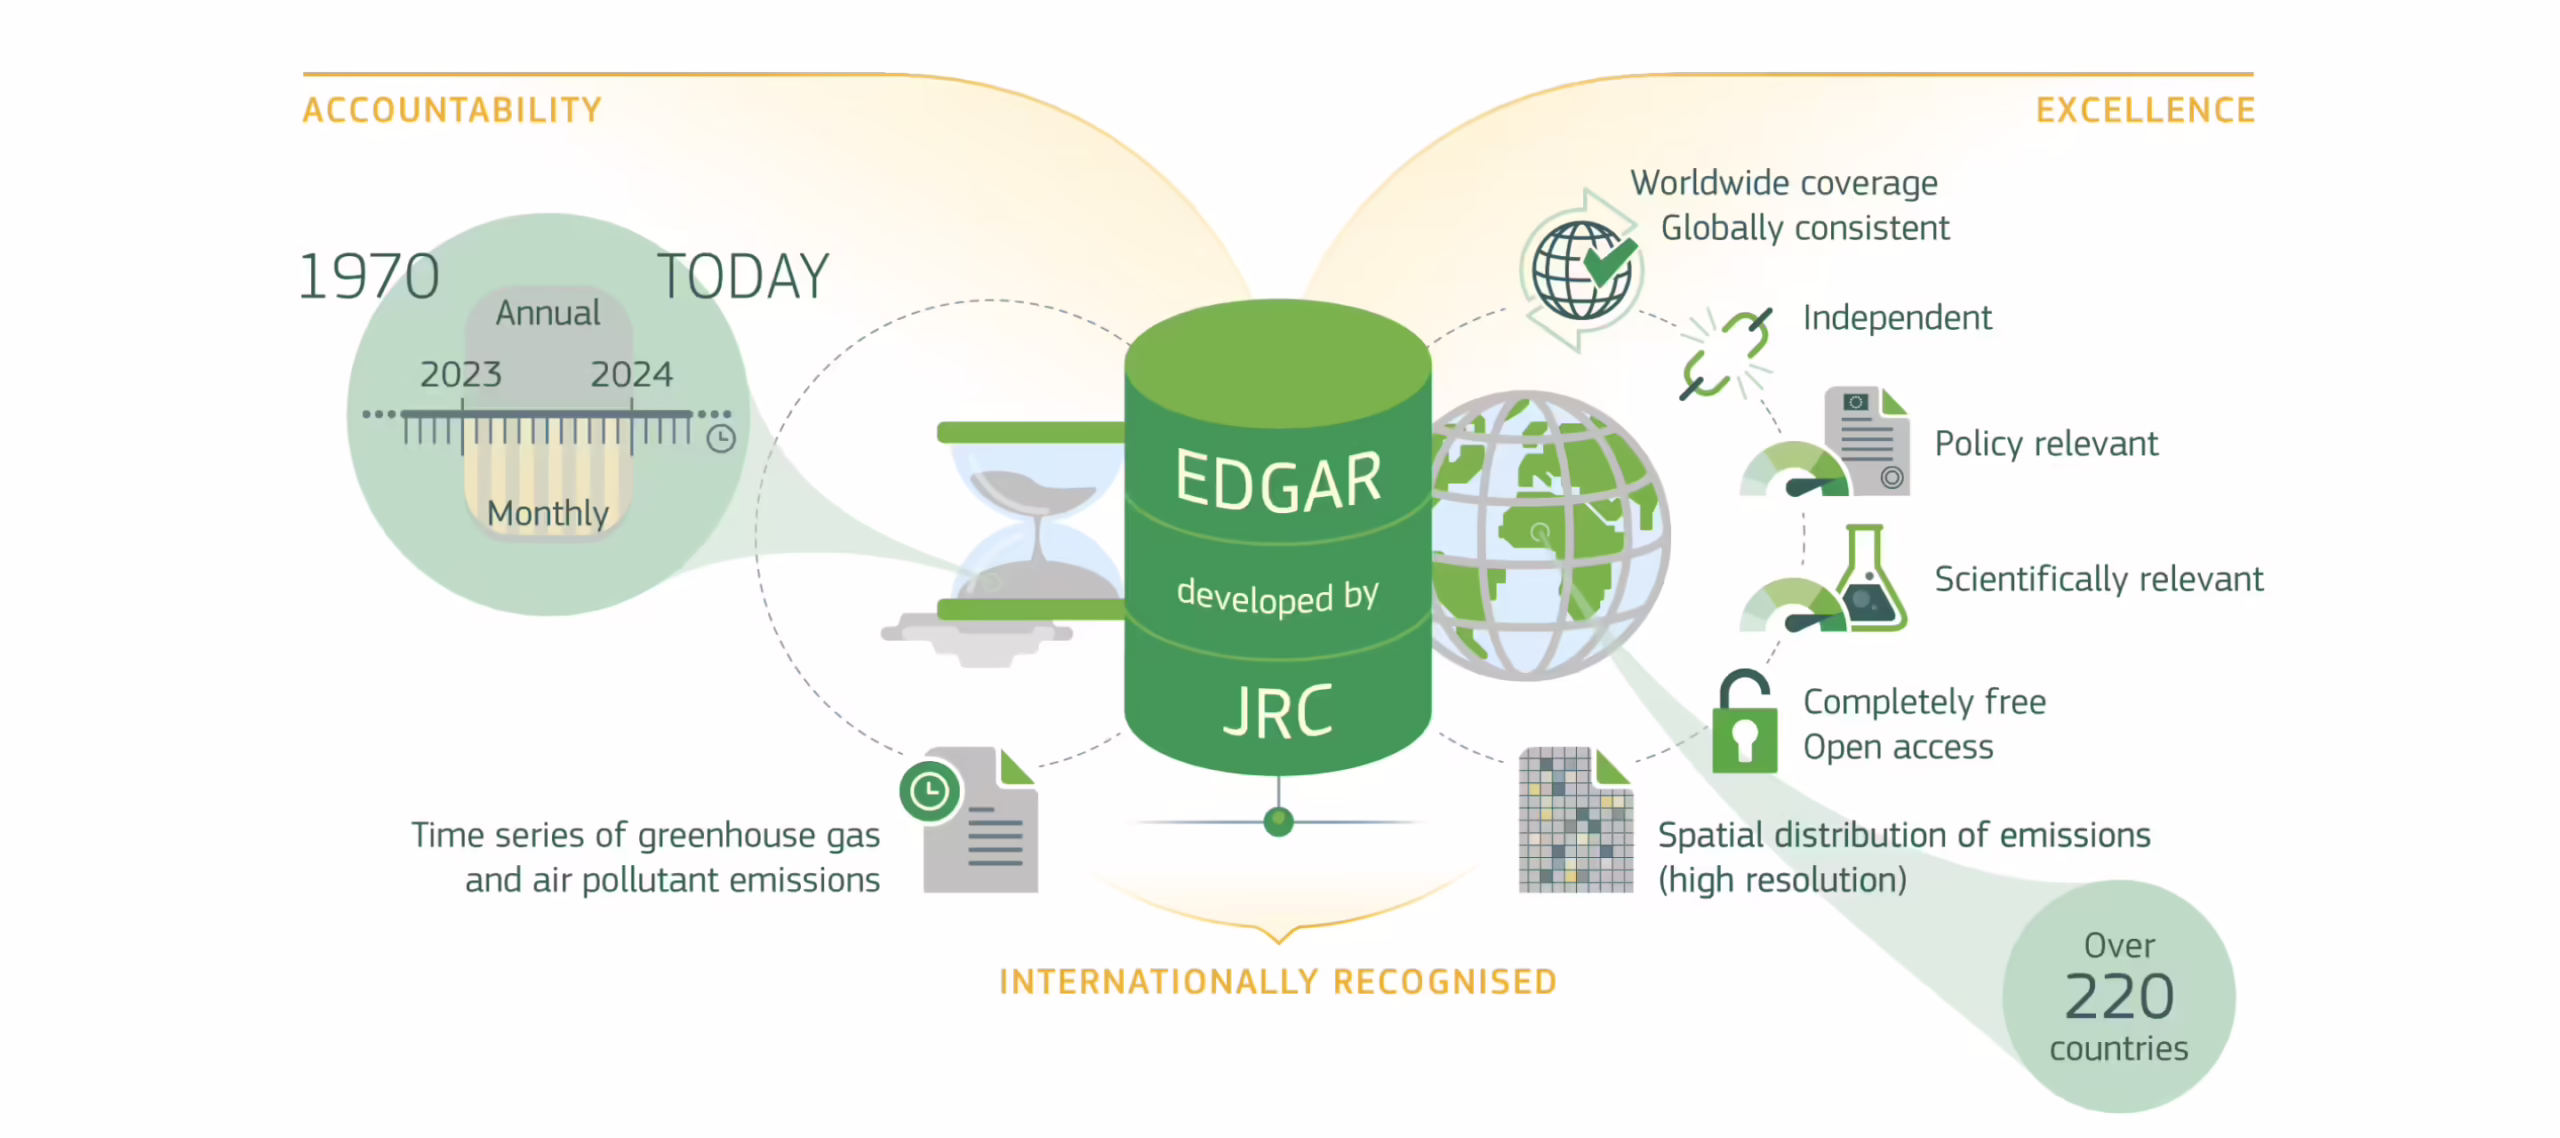
- Volume: Global GHG/air pollutants, 1970–present
- Access: Free
- Task Fit: Emissions modeling, policy tracking, inventory QA
The planet’s emissions ledger by country and sector. Ideal for NDC tracking and ESG dashboards. Bring receipts to your decarbonization story.
15. CDIAC Carbon Dioxide Data (NOAA)
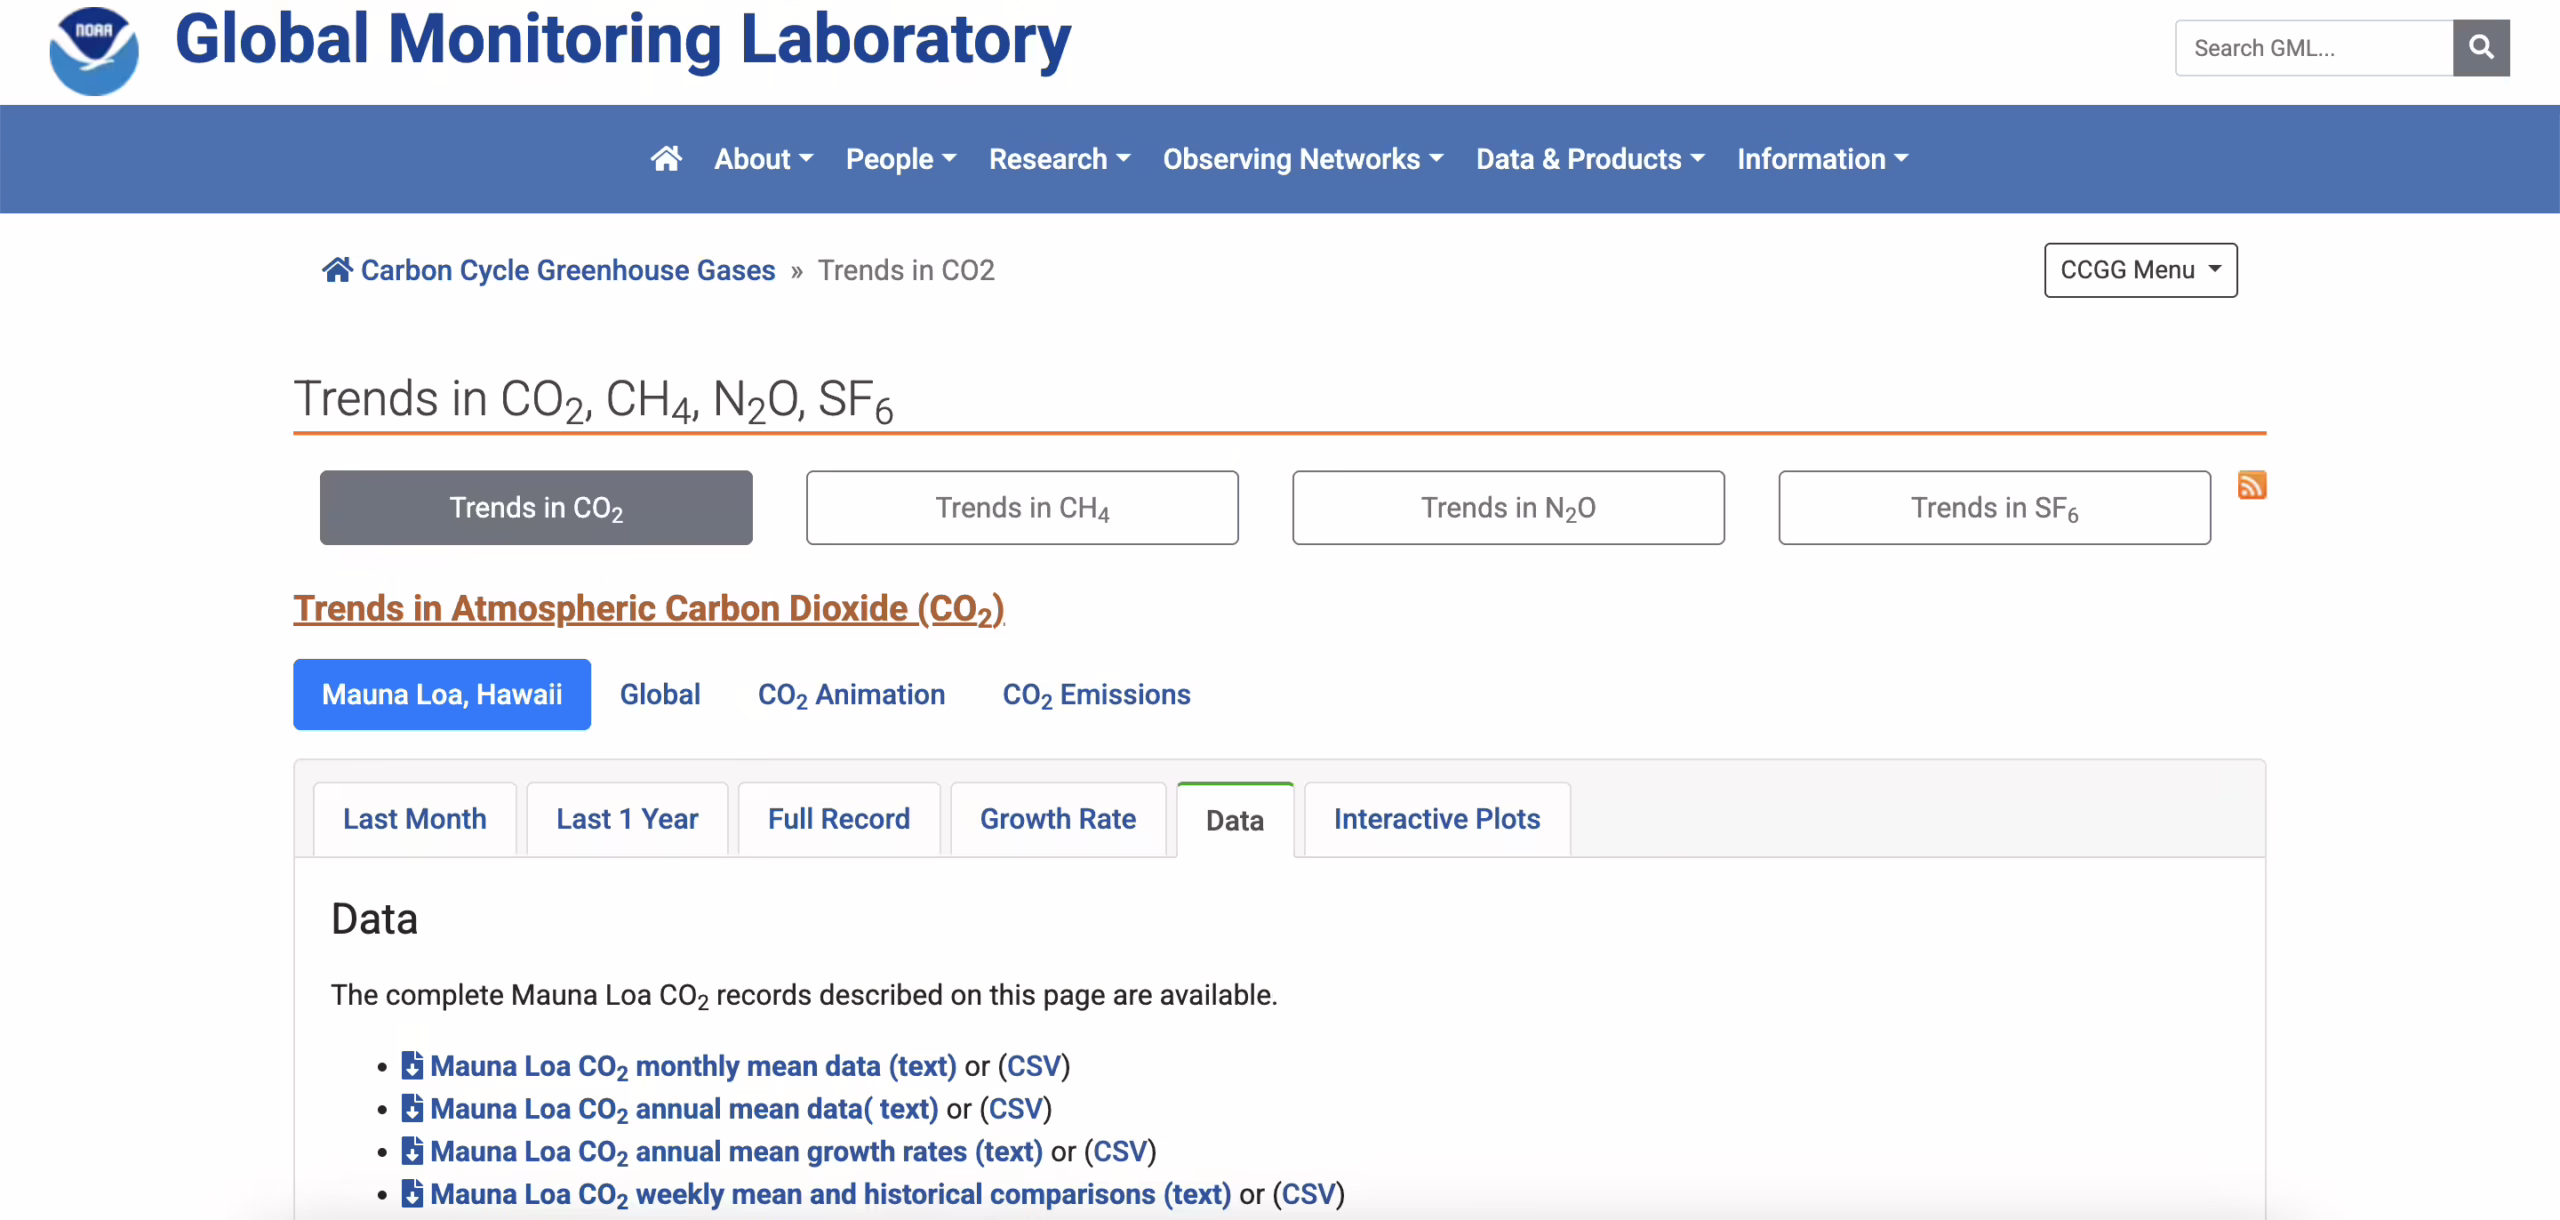
- Volume: Global records from 18th century to present
- Access: Free
- Task Fit: CO₂ trends, emissions modeling, paleoclimate validation
A long-standing archive of CO₂ and other greenhouse gases from atmospheric stations, ice cores, and energy statistics. Still one of the most trusted sources for emissions and concentrations. Perfect for long-term carbon cycle studies and model validation.
Pollution & Chemicals
16. Toxics Release Inventory (EPA)
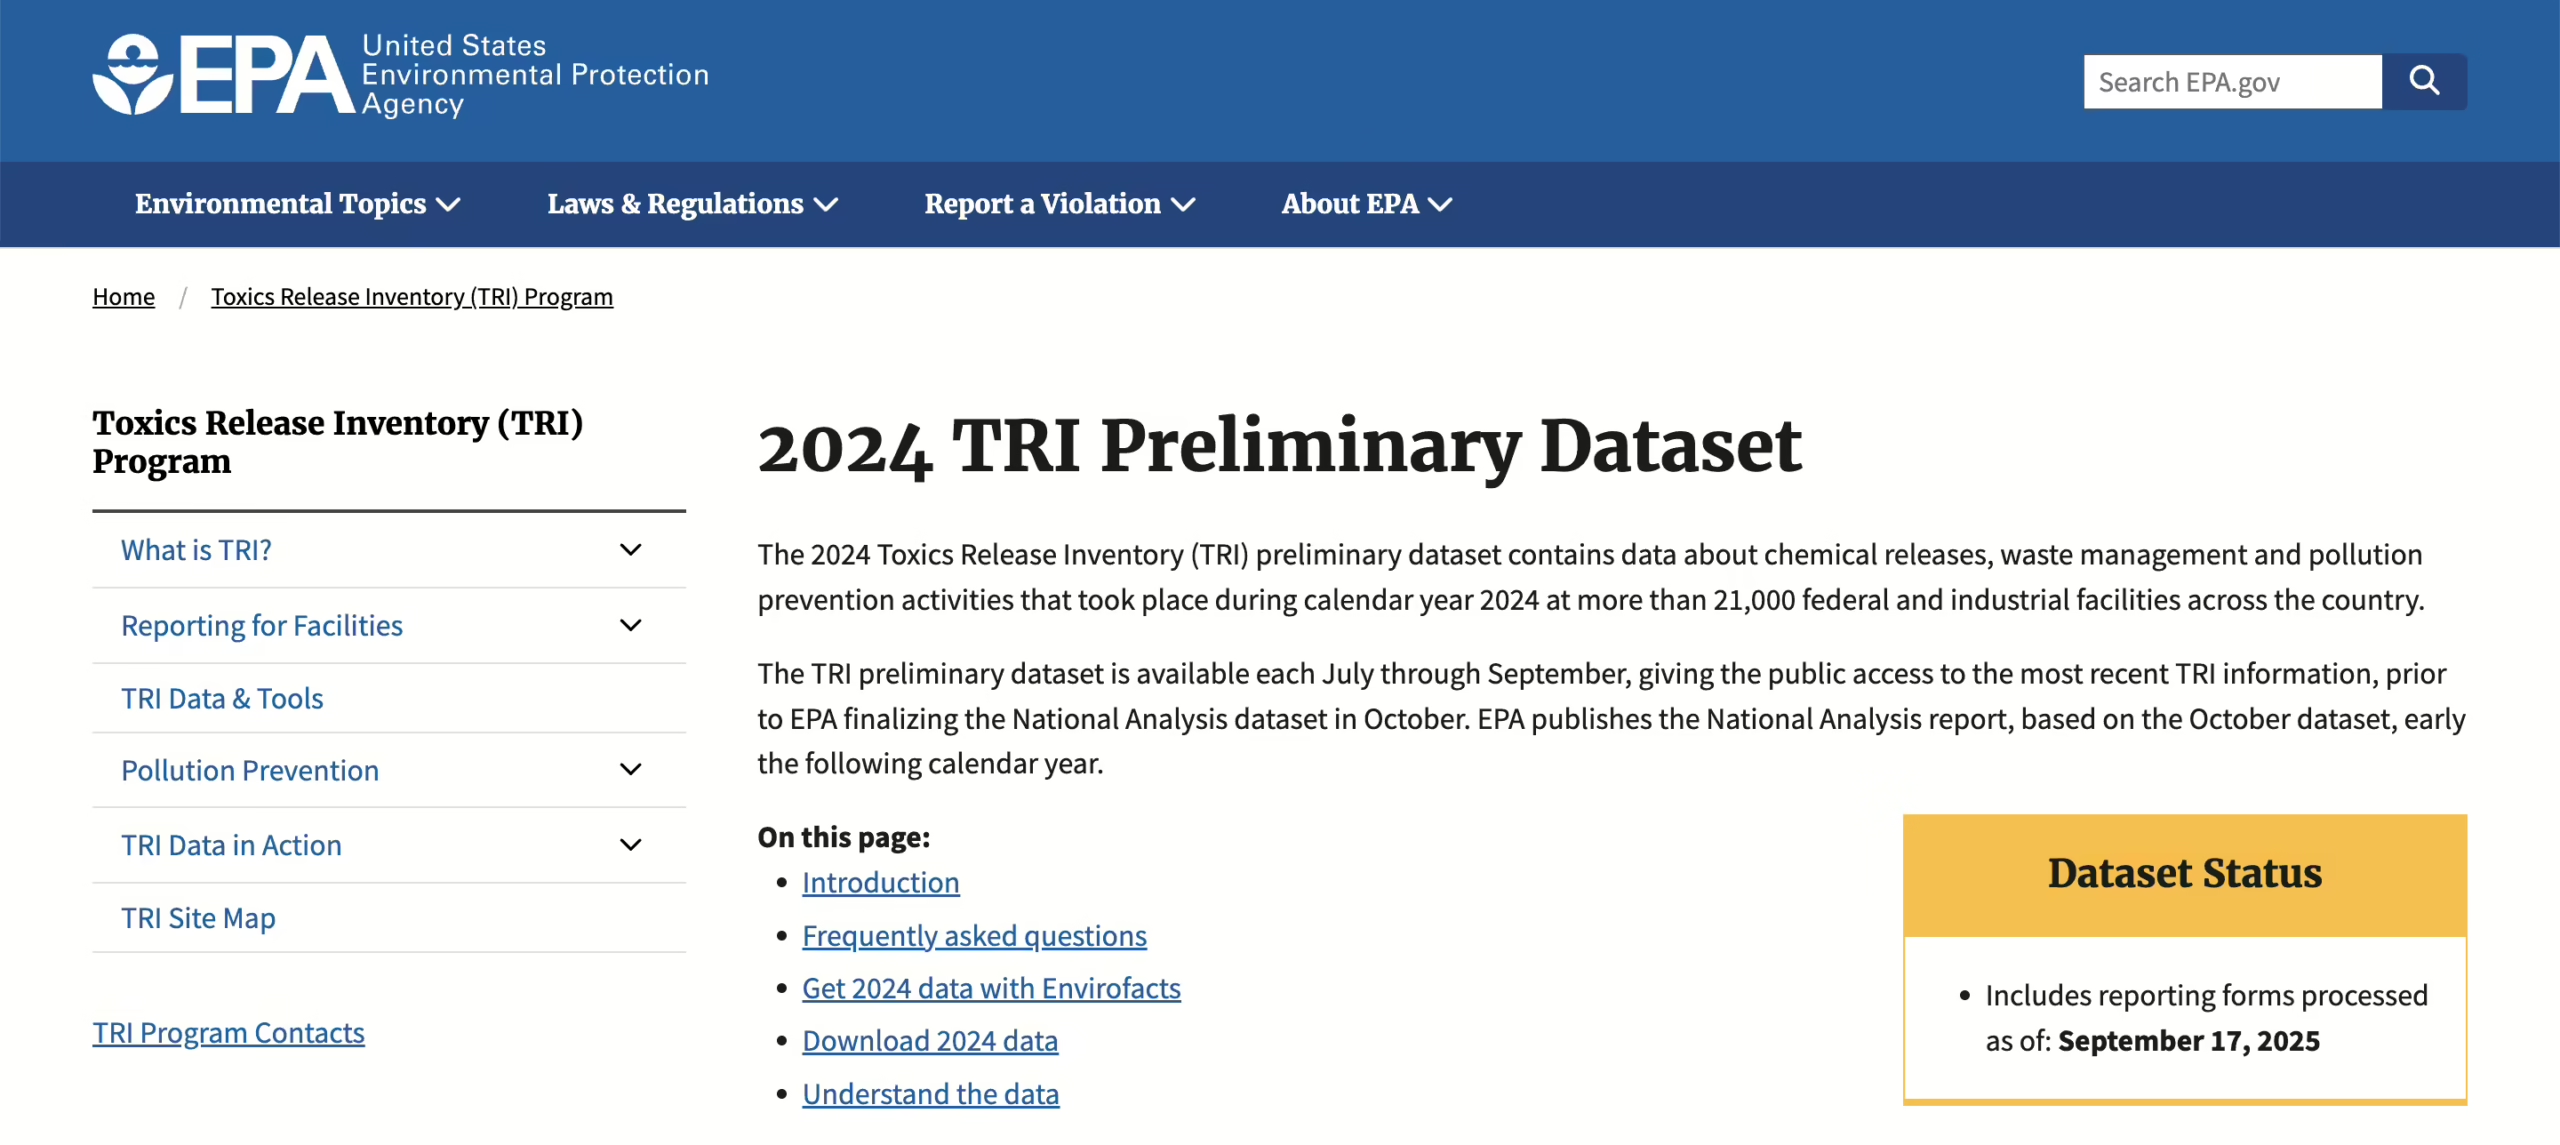
- Volume: 21k+ U.S. facilities, 800+ substances
- Access: Free
- Task Fit: Exposure modeling, risk maps, compliance
A factory-floor diary of releases with location and amounts. Join demographics and health for impact analysis. A staple for environmental justice projects.
17. EPA Air Quality System (AQS)
- Volume: Millions of hourly and daily observations since 1980
- Access: Free (API/CSV)
- Task Fit: Air quality modeling, exposure studies, regulatory tracking
A rich archive of ground-based air monitoring data covering ozone, PM2.5, CO, and other pollutants. Collected from thousands of sites across the U.S. and fully downloadable through APIs. Perfect for time-series analysis, pollution modeling, and environmental health studies.
Climate Benchmarks for ML
18. So2Sat LCZ42
- Volume: 400k+ labeled patches, 42 cities
- Access: Free (research)
- Task Fit: Remote sensing classification, urban climate zones
The go-to benchmark for urban morphology. Multi-sensor inputs play nicely with deep nets. Pretrain here, then transfer to real city tasks.
19. ClimateNet
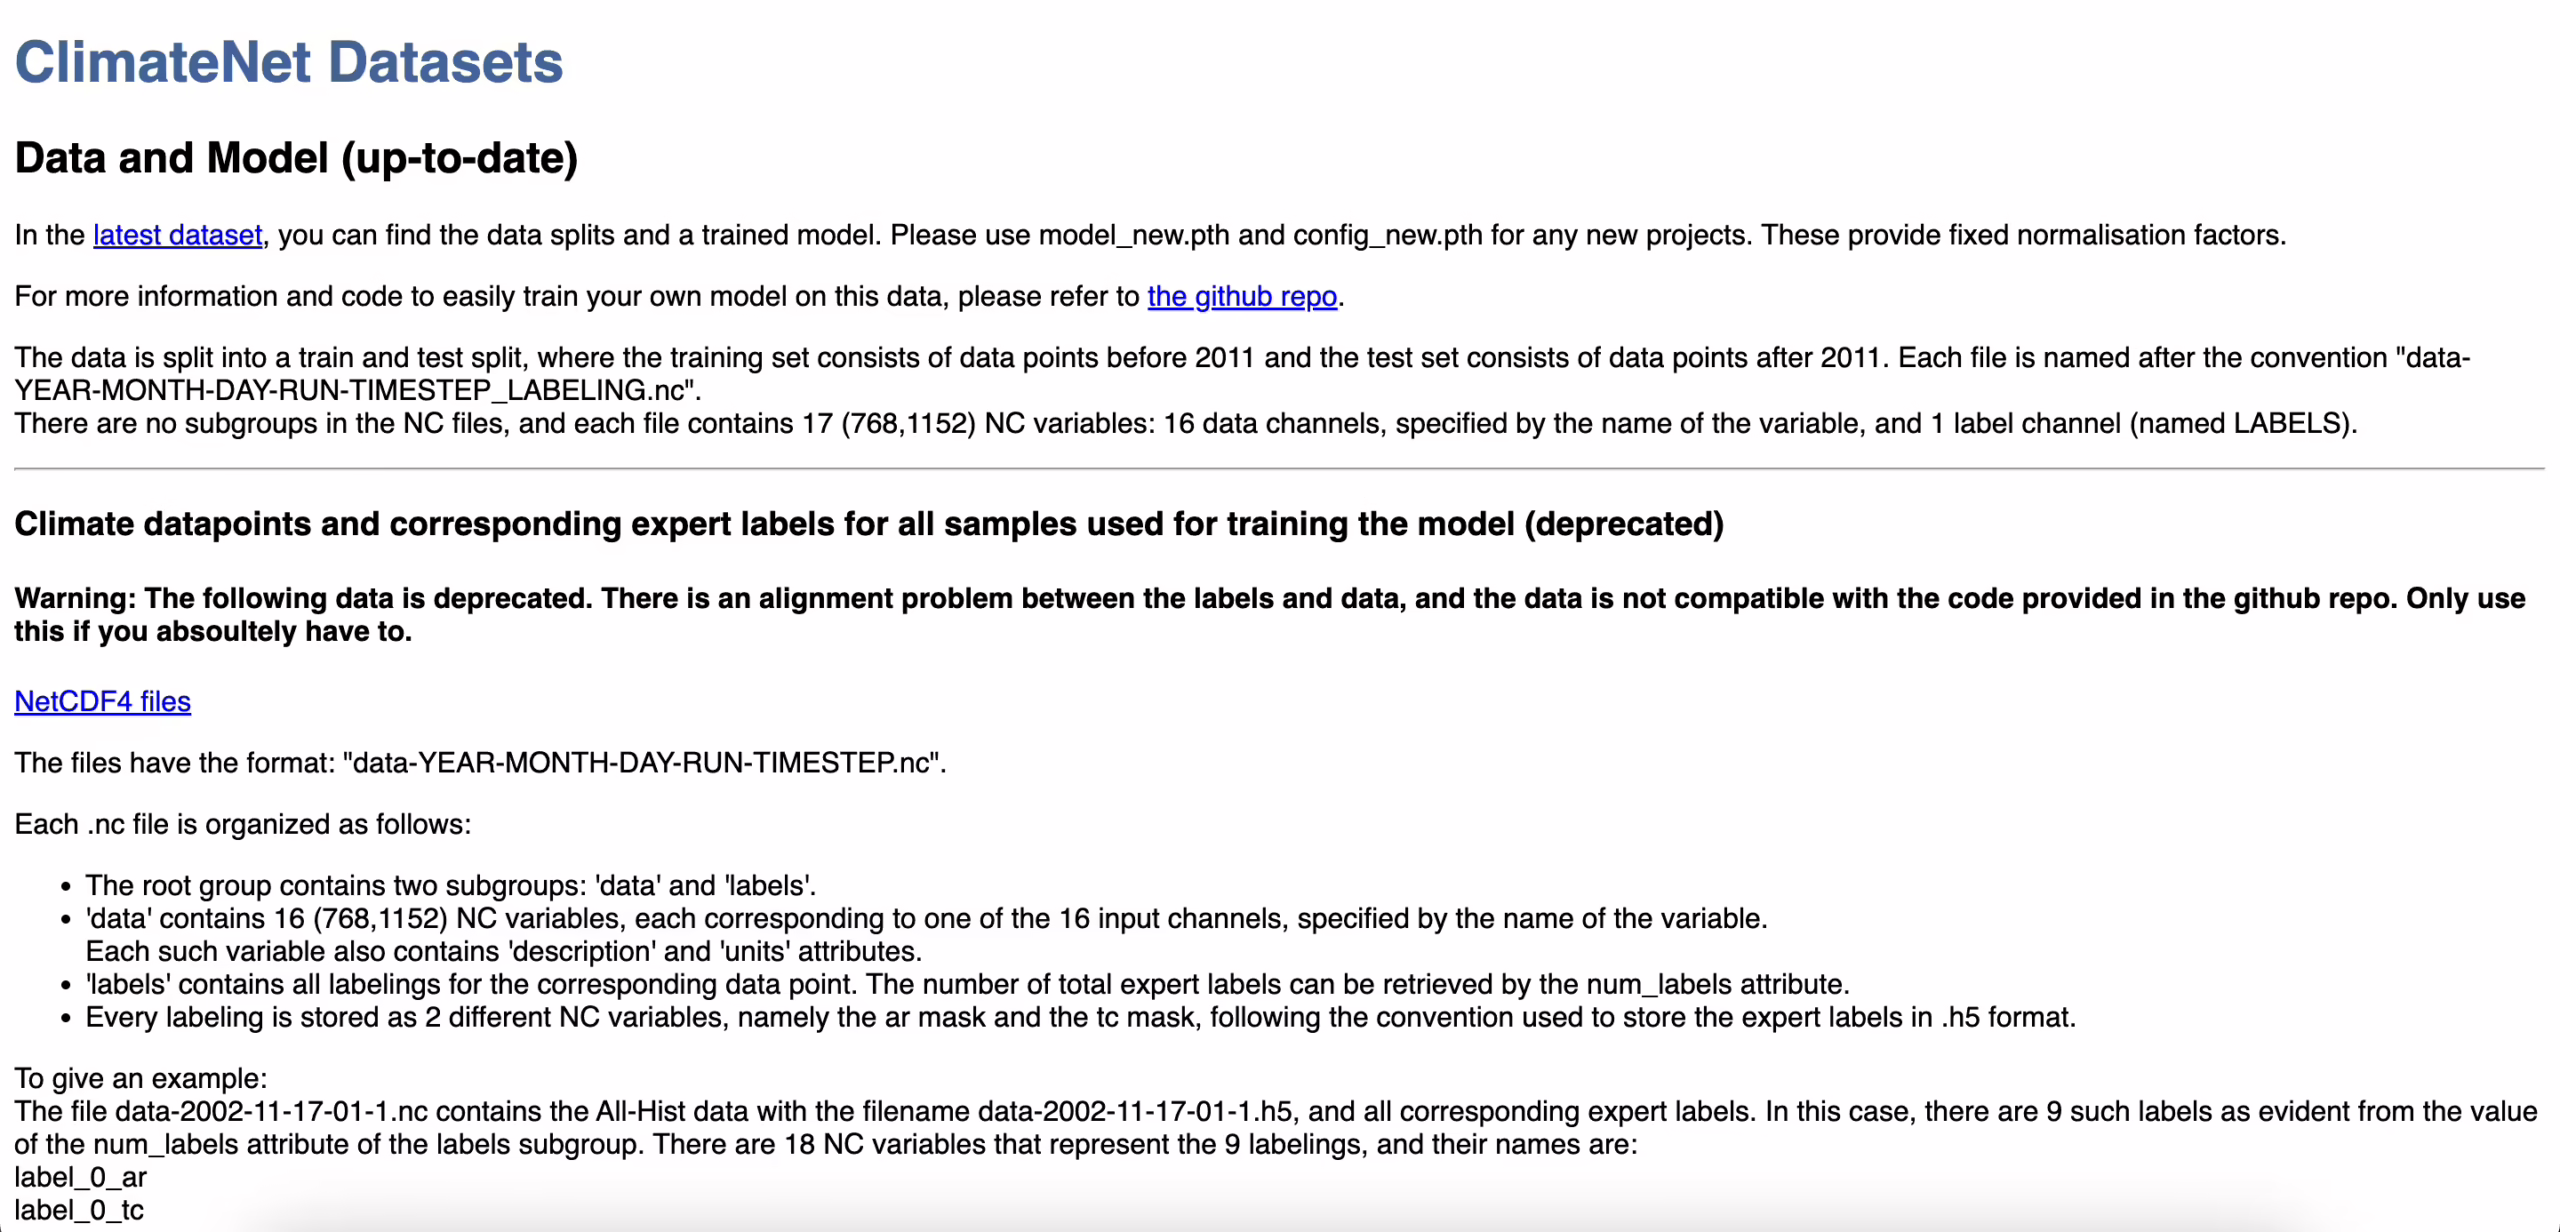
- Volume: 50k+ human-labeled patterns
- Access: Free
- Task Fit: Spatiotemporal classification, event detection
Crowd-labeled extremes in climate outputs. Teach models to spot cyclones, fronts, and atmospheric rivers. Build detectors that generalize beyond one run.
20. ClimART
- Volume: 8M+ samples of radiative transfer outputs
- Access: Free
- Task Fit: Physics emulation, emulator training
Let neural nets stand in for expensive radiative calculations. Keep physical realism while speeding iteration. Perfect for rapid climate-physics experiments.
🌍 Environmental & Climate Dataset Cheat-Sheet (click to expand)
Reanalysis & Climate Records
| Dataset | Volume | Coverage | Special Features | Ideal Use Case | Access |
|---|---|---|---|---|---|
| ERA5 (Copernicus) | ~30 PB | 1940–present, global | Hourly reanalysis | Forecasting, baselines | Free (CDS) |
| Copernicus CDS | 20+ PB | Land, ocean, atmosphere | Multi-source hub | Scenario modeling | Free (registration) |
| GHCN (NOAA) | 100+ years | Global stations | Daily QC records | Trends, anomalies | Free (CSV/API) |
| WorldClim | 1 km grids | Global | Bioclim variables | Ecology, niche models | Free |
| Berkeley Earth | 1.6B+ reports | Global | Transparent methods | Bias checks, charts | Free (CSV) |
| HadCRUT | 1850–present | Global | Long-term temps | Anomalies, attribution | Free |
Remote Sensing & Land Use
| Dataset | Volume | Resolution | Special Features | Ideal Use Case | Access |
|---|---|---|---|---|---|
| MODIS Land Products | Daily since 2000 | 250m–1km | NDVI, fires | Vegetation, land cover | Free (NASA LP DAAC) |
| Sentinel-2 | ~1 TB/day | 10–60m | Multispectral | Crops, disasters | Free (Copernicus) |
| Global Forest Change | 2000–present | 30m | Annual loss/gain | Deforestation, carbon | Free (GEE) |
| Cropland Data Layer | Annual, since 2008 | 30m (US) | Crop types | Agriculture AI | Free (USDA) |
| PRISM (USA) | 1895–present | ~4 km | Interpolated climate | Regional modeling | Free |
| SAGE Land-Use | Decadal records | Global | Historical croplands | Land-change drivers | Free |
Ocean, Atmosphere & Emissions
| Dataset | Volume | Coverage | Special Features | Ideal Use Case | Access |
|---|---|---|---|---|---|
| ICOADS | 300M+ obs | 1662–present | Ships & buoys | SST, winds | Free (NOAA) |
| EDGAR (EU JRC) | 1970–present | Global | Sectoral emissions | Policy tracking | Free |
| CDIAC (NOAA) | 18th c.–present | Global | CO₂ & GHG | Carbon cycle studies | Free |
Pollution & Chemicals
| Dataset | Volume | Coverage | Special Features | Ideal Use Case | Access |
|---|---|---|---|---|---|
| Toxics Release Inventory | 21k+ facilities | US | 800+ substances | Risk maps, compliance | Free (EPA) |
| EPA AQS | 1980–present | US | Air pollutants | Exposure modeling | Free (API/CSV) |
Climate Benchmarks for ML
| Dataset | Volume | Coverage | Special Features | Ideal Use Case | Access |
|---|---|---|---|---|---|
| So2Sat LCZ42 | 400k+ patches | 42 cities | Urban zones | Remote sensing ML | Free (research) |
| ClimateNet | 50k+ patterns | Global (models) | Extreme events | Event detection | Free |
| ClimART | 8M+ samples | Global | Radiative transfer | Physics emulation | Free |
Wrapping Up
From free government archives to premium curated sets, climate datasets are everywhere — but not all are equal. Use ERA5 if you need deep historical weather, Sentinel-2 for pixel-level imagery, and EDGAR for emissions. And when you need a dataset shaped exactly for your model? That’s where Unidata comes in.