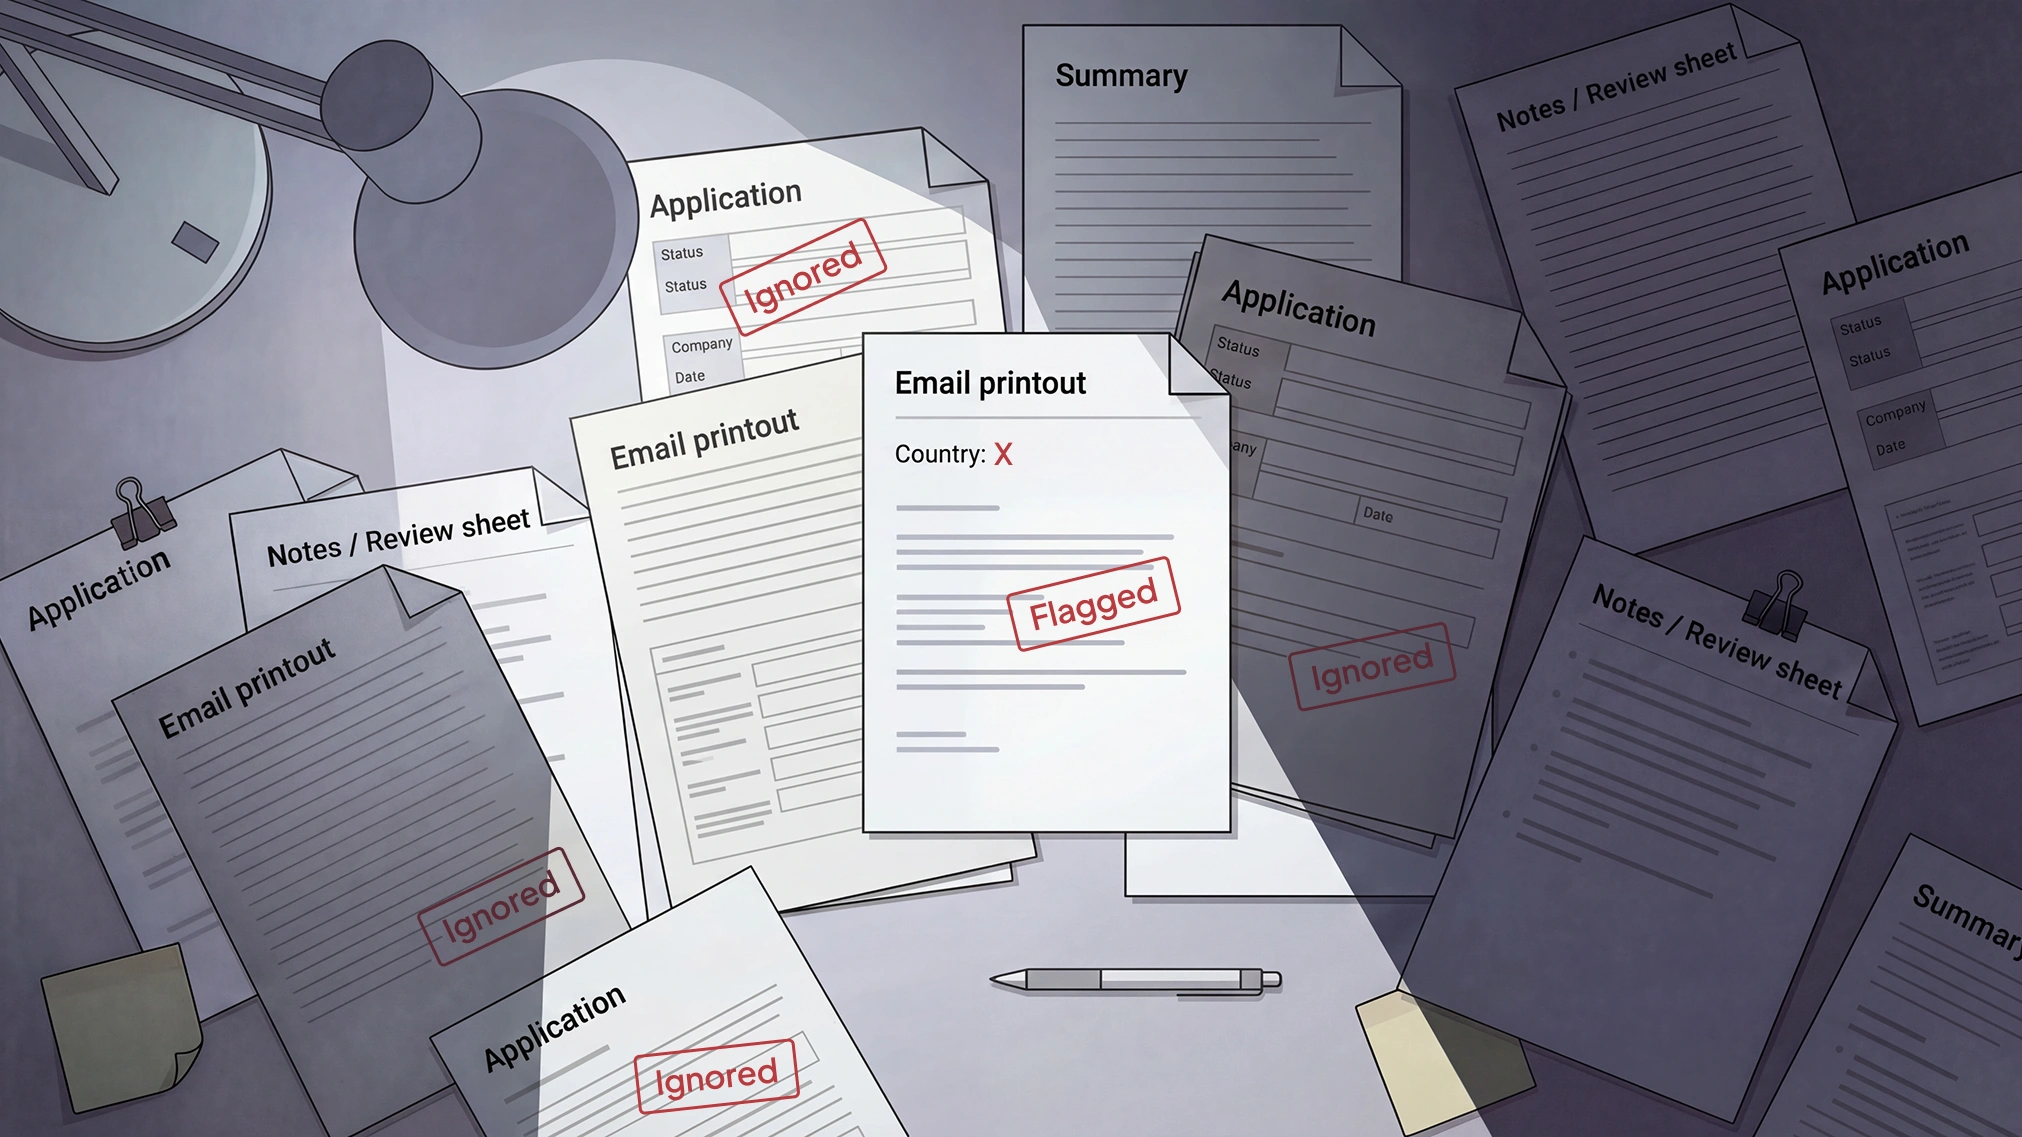
Machine learning bias happens when an ML model starts making skewed decisions — not from malice, but because its training data told it to. Instead of staying neutral, the system plays favorites. Emails from certain countries? Flagged. Female applicants? Ignored. That’s AI bias in action. It’s often baked in by biased data, faulty algorithms, or the good old cognitive bias of the humans who build them.
Important note: this isn’t about the bias–variance tradeoff. We’re not talking tuning curves — we’re talking bias that leads to algorithmic discrimination.
What Is Machine Learning Bias (and How Does It Occur)?
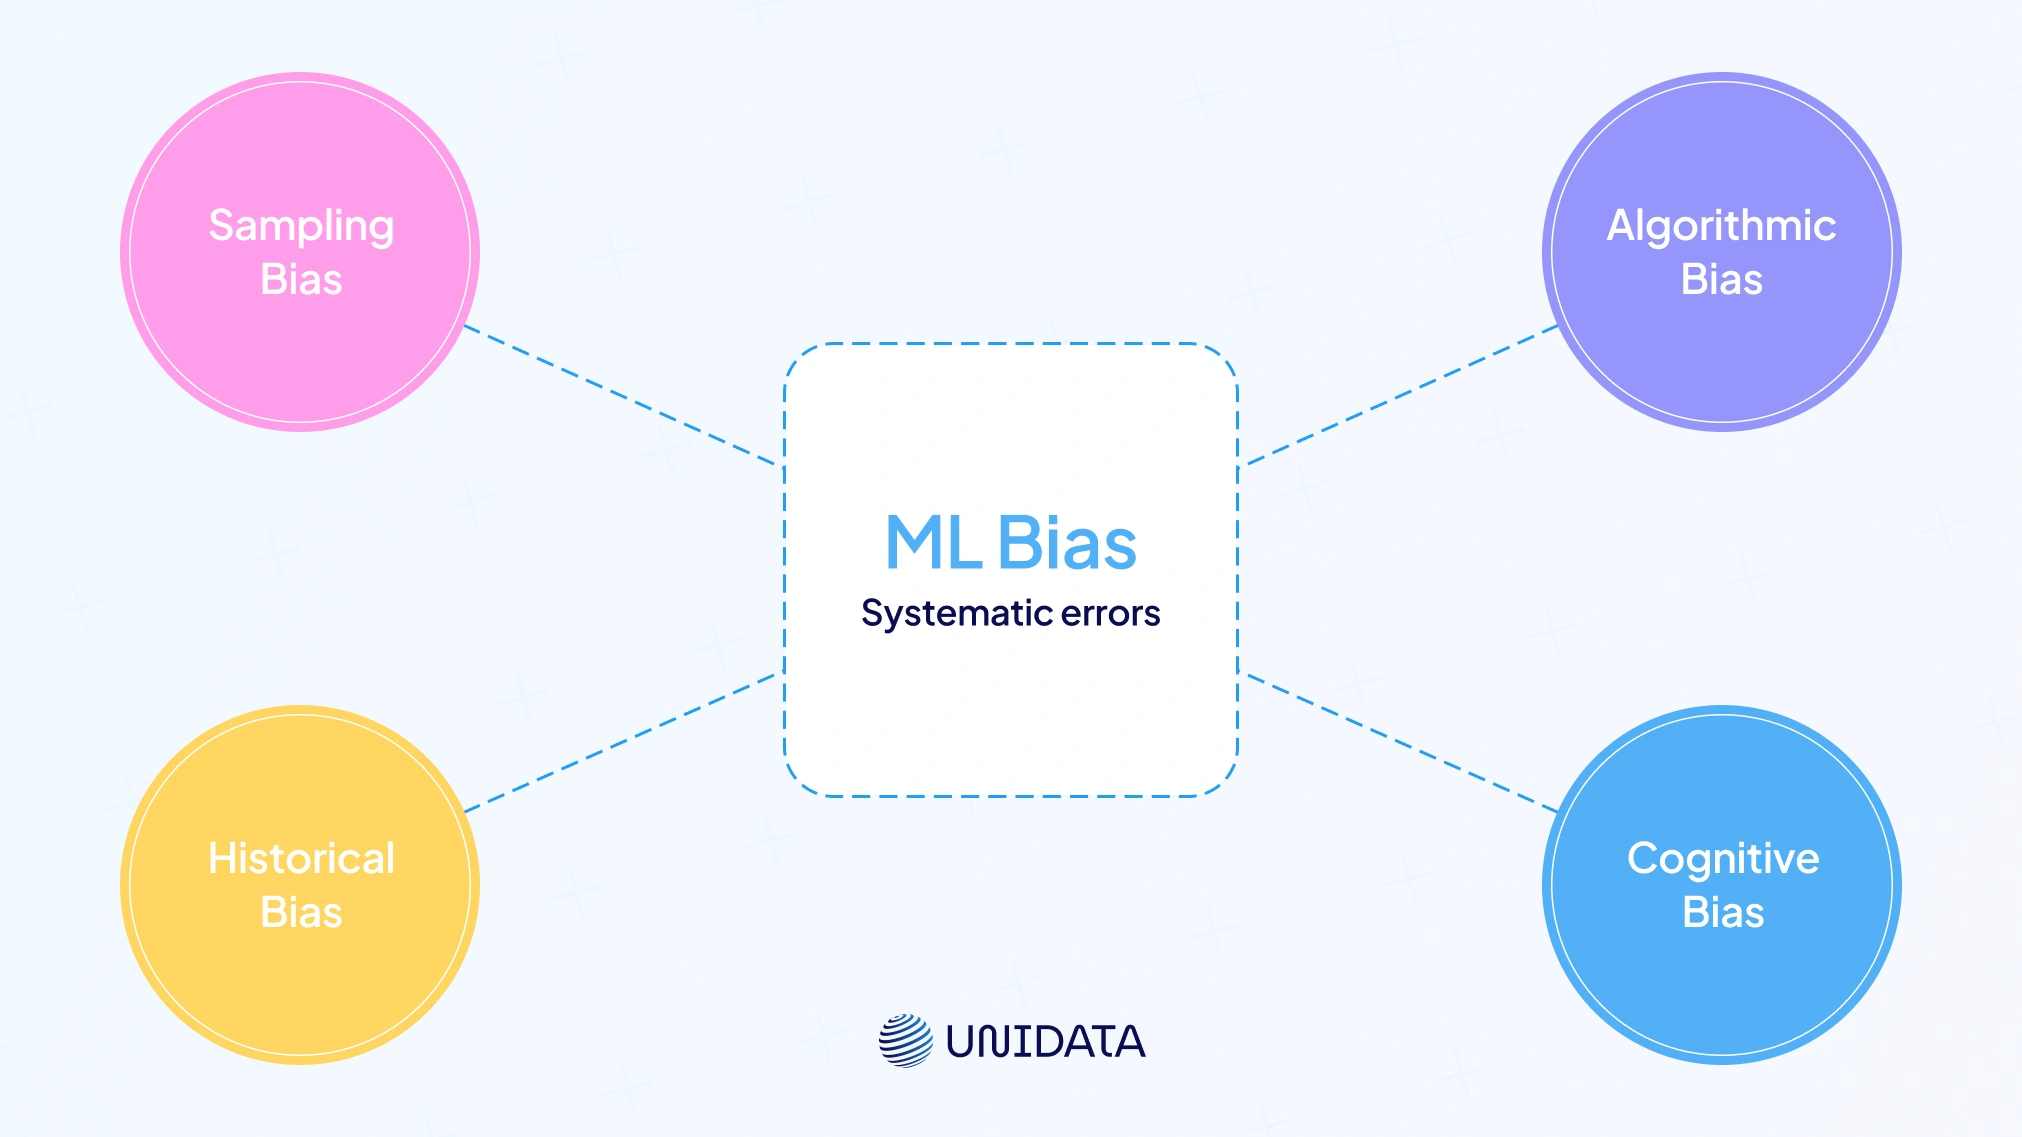
Machine learning bias refers to systematic errors in an ML model’s predictions—not random noise, but patterns that unfairly favor or penalize certain outcomes or groups. This happens when the model learns from biased data, inherits cognitive bias from developers, or when its design creates algorithmic bias.
Where does it come from?
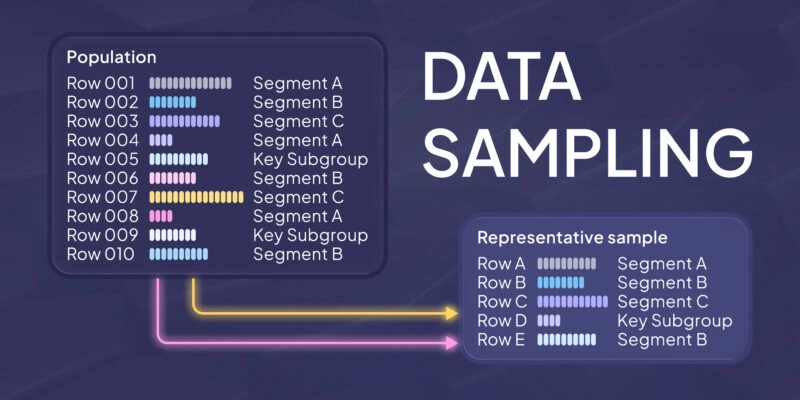
- Sampling bias: Your training data skips parts of the population.
- Historical bias: Prejudiced past = biased model.
- Algorithmic bias: The algorithm unintentionally favors certain outcomes.
- Cognitive bias: Human assumptions seep into labeling and design.
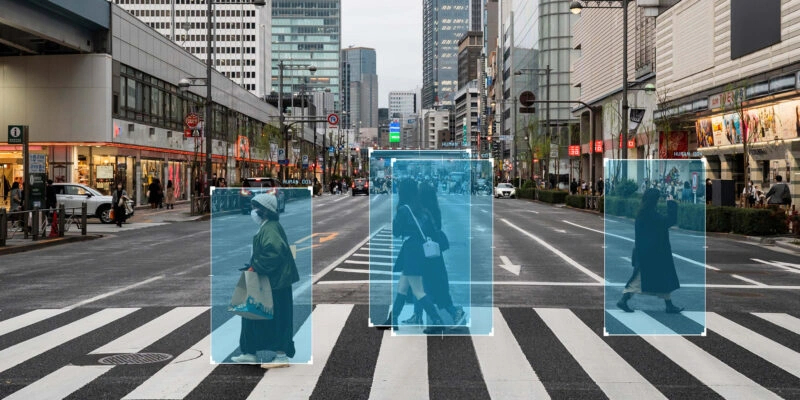
Most AI bias comes from flawed data collection, not flawed code. The fallout? Skewed facial recognition, loan denials by zip code, and biased content at scale. Understand where bias occurs, and you’re one step closer to preventing it.
Common Types of Bias in Machine Learning
Researchers have identified many types of ML bias, each with a slightly different cause. Below is a quick comparison of some common bias types, how they arise, and examples of their impact:
| Bias Type | How It Occurs | Example Impact |
|---|---|---|
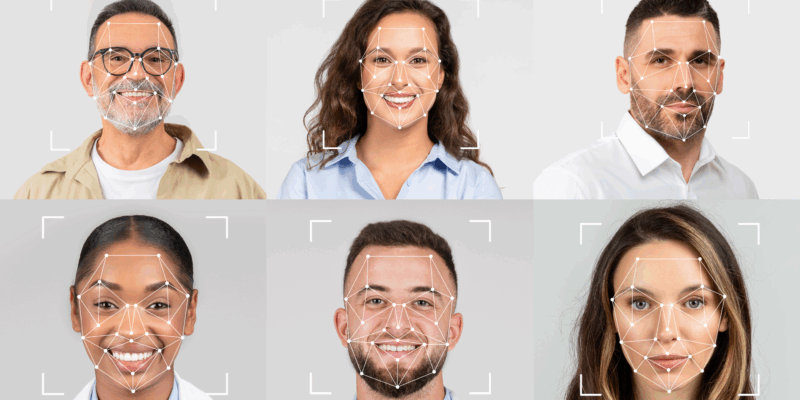
| Sampling Bias (Selection Bias) | Training data isn’t representative of the target population (coverage gaps). | Face dataset mostly of light-skinned individuals leads to poor recognition of darker-skinned faces. |
| Historical Bias (Prejudice) | Data reflects past prejudices or inequalities, embedding societal bias. | Hiring model trained on decades of male-dominated resumes favors male candidates. |
| Confirmation Bias | Data is selectively gathered in ways that confirm an existing hypothesis. | Predictive policing oversamples neighborhoods already heavily policed, reinforcing a cycle of over-policing. |
| Algorithmic Bias | The model or algorithm design creates skewed outcomes, often by amplifying biases in data. | A résumé screening algorithm learns to prefer applicants from one demographic due to unbalanced training data. |
As the table shows, bias wears many hats in AI systems. These biases often overlap. For example, selection bias (who’s in your dataset) can lead to historical bias if the chosen group reflects past discrimination. You might also come across terms like reporting bias. That happens when the number of events in data doesn’t match real-world patterns — such as overly positive reviews in training data. Or group attribution bias, which means assuming all members of a group are the same. This causes stereotyping.
The key point is that bias can enter the picture in many ways. It can come from bad data sampling, old or incomplete historical data, human assumptions, or even how people use the system. Knowing these bias types is half the battle in spotting and reducing bias in machine learning.
Detecting and Reducing Bias in Training Data
The best place to spot ML bias is in your training data. Look at how well your dataset reflects reality. Do outcomes differ across groups? These steps will help you detect bias and reduce it.
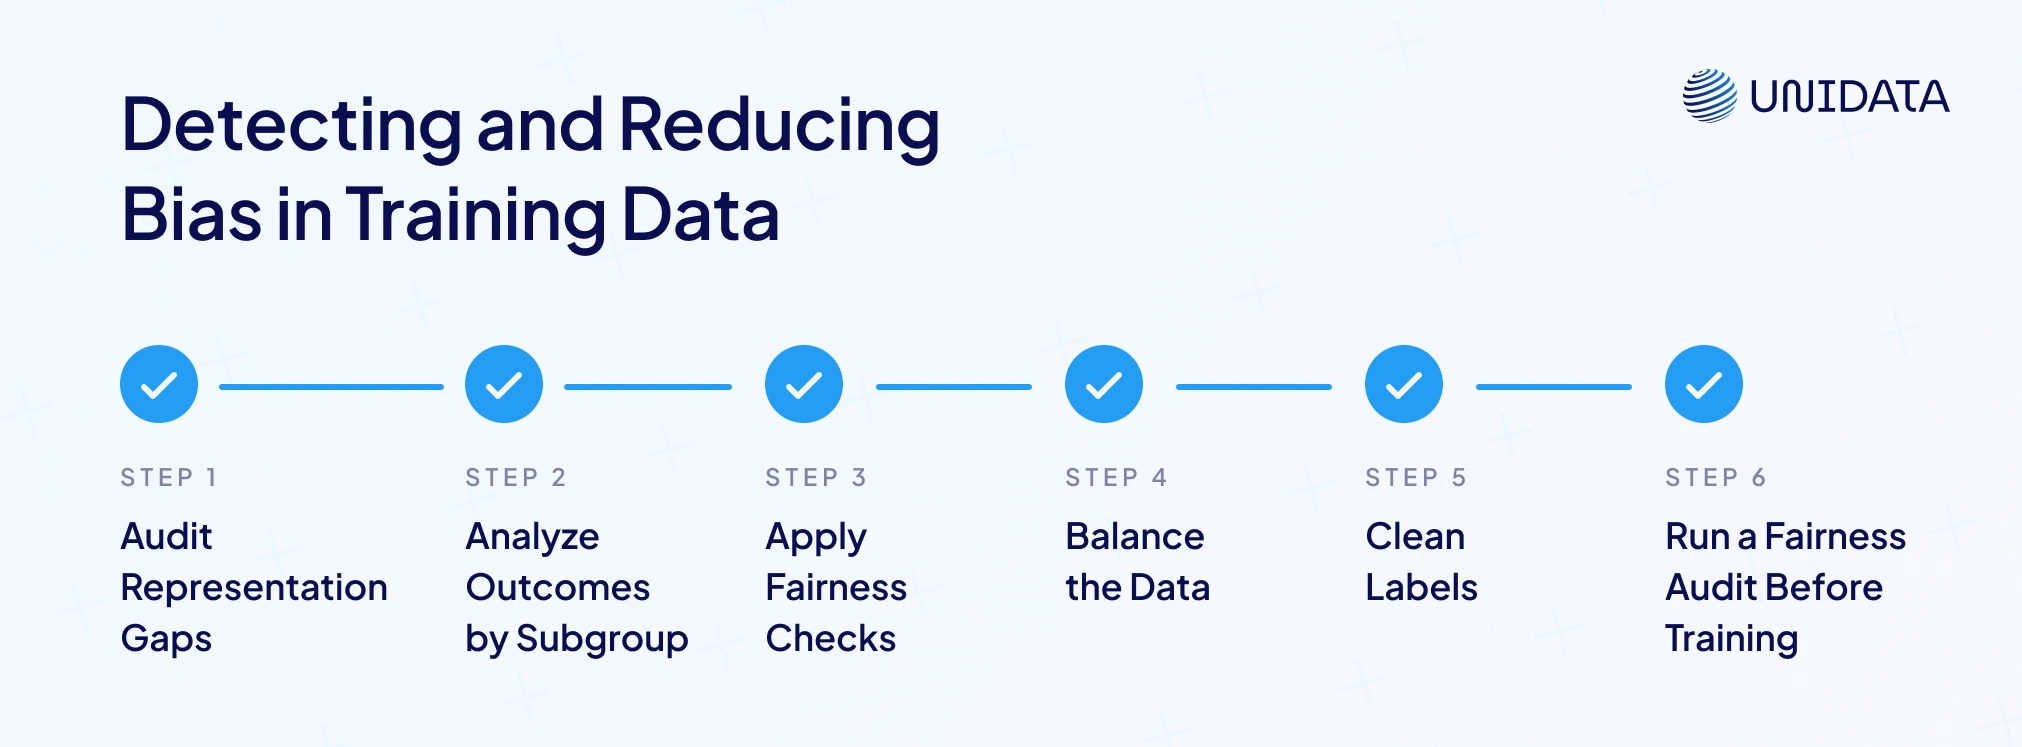
Audit for representation gaps
Check for coverage bias. Are key demographics included? If you're training a lending model, does it mostly contain wealthy borrowers? Tools like data sheets or dataset nutrition labels can flag imbalances. A simple check might show 90% of your data comes from one gender or region — a warning sign of selection bias.
Analyze outcomes by subgroup
If your data includes decisions (like loan approvals), break it down by race, gender, or age. Are certain groups seeing more negative results? These patterns can be learned by the model. Use charts to compare approval rates or feature distributions. This can reveal hidden bias before it takes hold.
Apply fairness metrics to historical data
These aren’t just for models. They help spot bias in your dataset too. For example, calculate the disparate impact ratio. If it’s below 0.8 (the “80% rule”), your data may fail a fairness check. Statistical parity is another metric to assess group outcomes.
Balance your data
When you find bias, fix it at the source. Collect more data for underrepresented groups or reduce samples from dominant ones. If your facial recognition set is 80% light-skinned faces, add more images of darker skin tones. Using diverse training data is recommended to build reliable and fair models. Techniques include oversampling, data augmentation, or using synthetic data — used carefully.
Clean your labels
Bias often hides in how data is labeled. Do spot checks or use multiple annotators. Avoid recall bias from stereotypes, like inconsistent labeling based on gender. Clear guidelines and consistent labels help eliminate measurement bias.
Fairness Metrics for Evaluating Bias
Once your ML model is trained, the next question is: is it fair? Fairness metrics help you evaluate this in clear, structured ways. But fairness isn’t universal — definitions can differ, and sometimes they even conflict.
Here are the most common metrics used to detect bias in machine learning models:
Demographic Parity (Statistical Parity)
This checks whether positive outcomes are equally likely for all groups. If 70% of men get loans, then about 70% of women should too. If one group’s approval rate is much lower, the model fails this test GeeksforGeeks. It’s easy to calculate and gives a broad view of fairness, but it doesn’t consider actual qualifications. In some cases, forcing parity can reduce accuracy if one group’s outcomes differ for valid reasons.
Disparate Impact (80% Rule)
Often used in compliance, this is a softer version of demographic parity. It says the protected group’s selection rate should be at least 80% of the majority group’s. If women are approved at 50% and men at 90%, the 0.56 ratio breaks the 0.8 rule. Many use this as a threshold test to flag problematic bias.
Equal Opportunity
This focuses on true positive rate (TPR) across groups. Everyone who qualifies for a positive prediction should have the same chance, no matter the group. If 90% of qualified men are approved but only 70% of qualified women, that’s an equal opportunity gap. It’s especially important in hiring or healthcare where missing qualified candidates has real consequences.
Equalized Odds
This stricter metric combines equal TPR and equal false positive rate (FPR). It ensures the model treats errors fairly across groups. In healthcare, for example, two groups with equal disease rates should have similar detection and false alarm rates. Achieving this may require advanced methods like reweighting or adversarial training. It’s demanding but considered a gold standard in fairness.
Individual Fairness
This principle says similar individuals should be treated the same. If two people have nearly identical data, they should get the same result—regardless of race or gender. It’s harder to measure than group metrics and often requires similarity functions or custom constraints.
Calibration by Group (Predictive Parity)
This checks if risk scores mean the same thing for everyone. If a 0.8 score implies an 80% risk, it should mean that for all groups. If Group A’s 0.8 score equals 60% actual risk and Group B’s means 90%, you’ve got a calibration issue. This matters in credit or criminal risk models (like COMPAS). Note: predictive parity often clashes with equalized odds, so you must choose the right metric for your use case (GeeksforGeeks).
These metrics help quantify model bias, but none cover everything. A key lesson in AI fairness: you can’t satisfy all metrics at once if base rates vary. A model may hit demographic parity but lose accuracy. Or meet equalized odds, but fail the 80% rule due to small group size. That’s why the best metric depends on your context. Regulators may require the 80% rule in hiring. In healthcare, equal opportunity might matter more.
Impact of Bias on Model Accuracy and Decision-Making
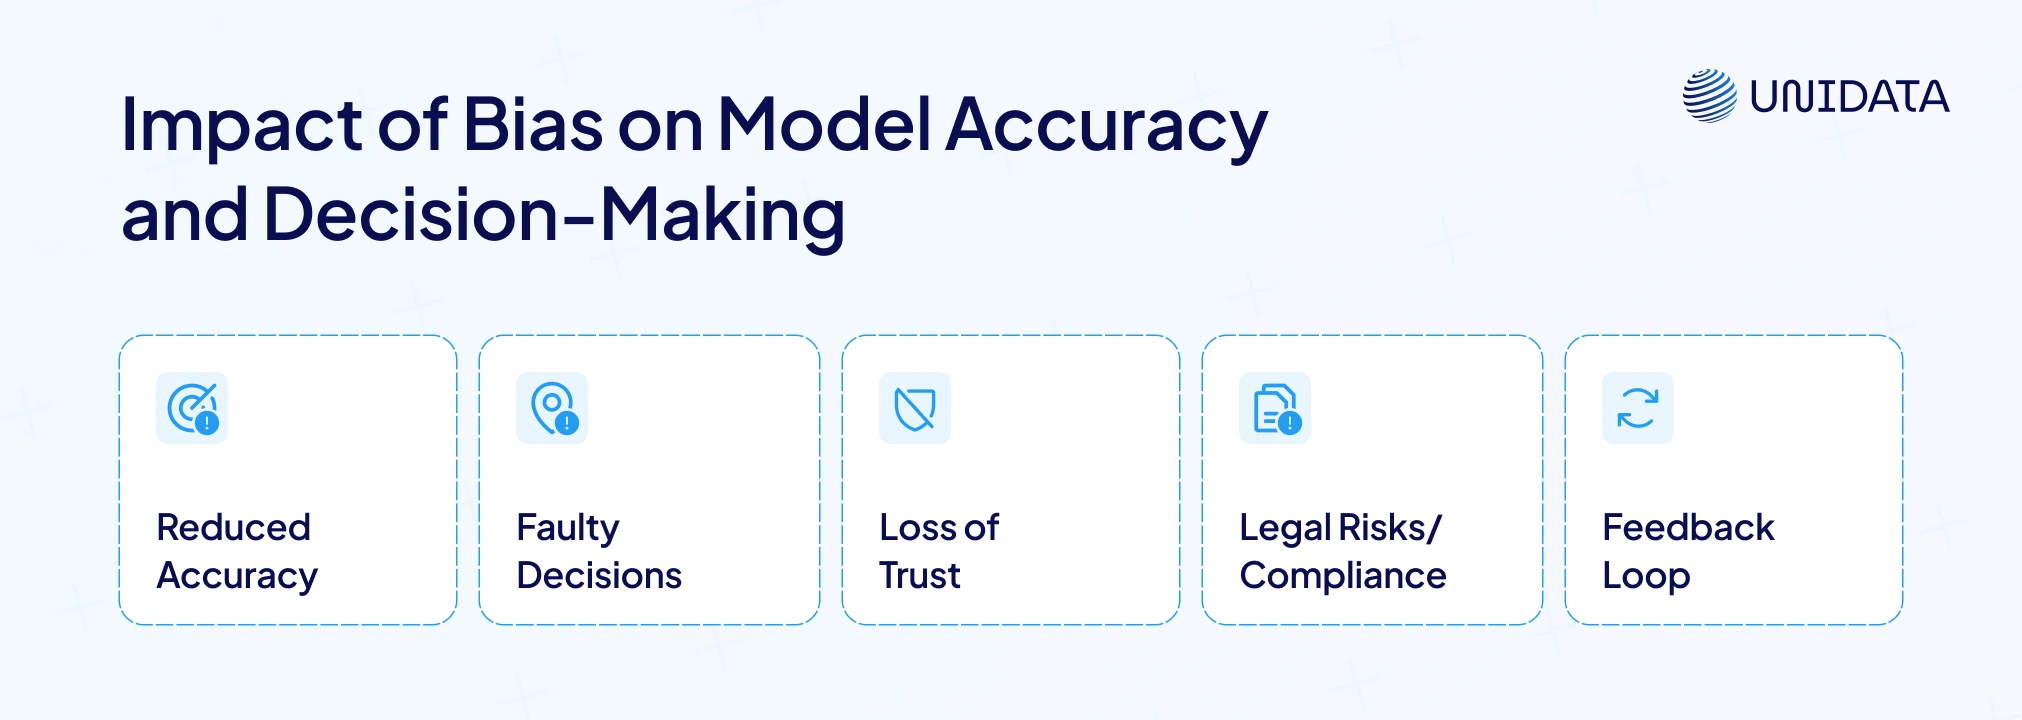
Bias affects more than fairness. It directly impacts your ML model’s accuracy and the quality of decisions your business makes.
Reduced Accuracy for Certain Groups
Biased models often perform worse for minority groups or less-common cases. For instance, an image classifier may hit 95% accuracy on lighter skin tones but only 80% on darker ones. This hurts overall reliability. High accuracy on average hides big gaps. These gaps signal high variance, meaning the model serves some users poorly. It may also be overfitting to the majority, weakening real-world performance.
Self-Reinforcing Feedback Loops
Bias can worsen over time. Take a newsfeed that slightly downranks posts from a smaller group. That group’s content gets less exposure, then less engagement—confirming the system’s original (flawed) pattern. This feedback loop causes the model to learn from its own biased outputs. The same thing happens in predictive policing — where over-surveillance in one area reinforces bias, while under-policed areas go unseen.
Strategies to Mitigate Algorithmic Bias
There’s no one-click solution for algorithmic bias, but several proven strategies can make a real difference.
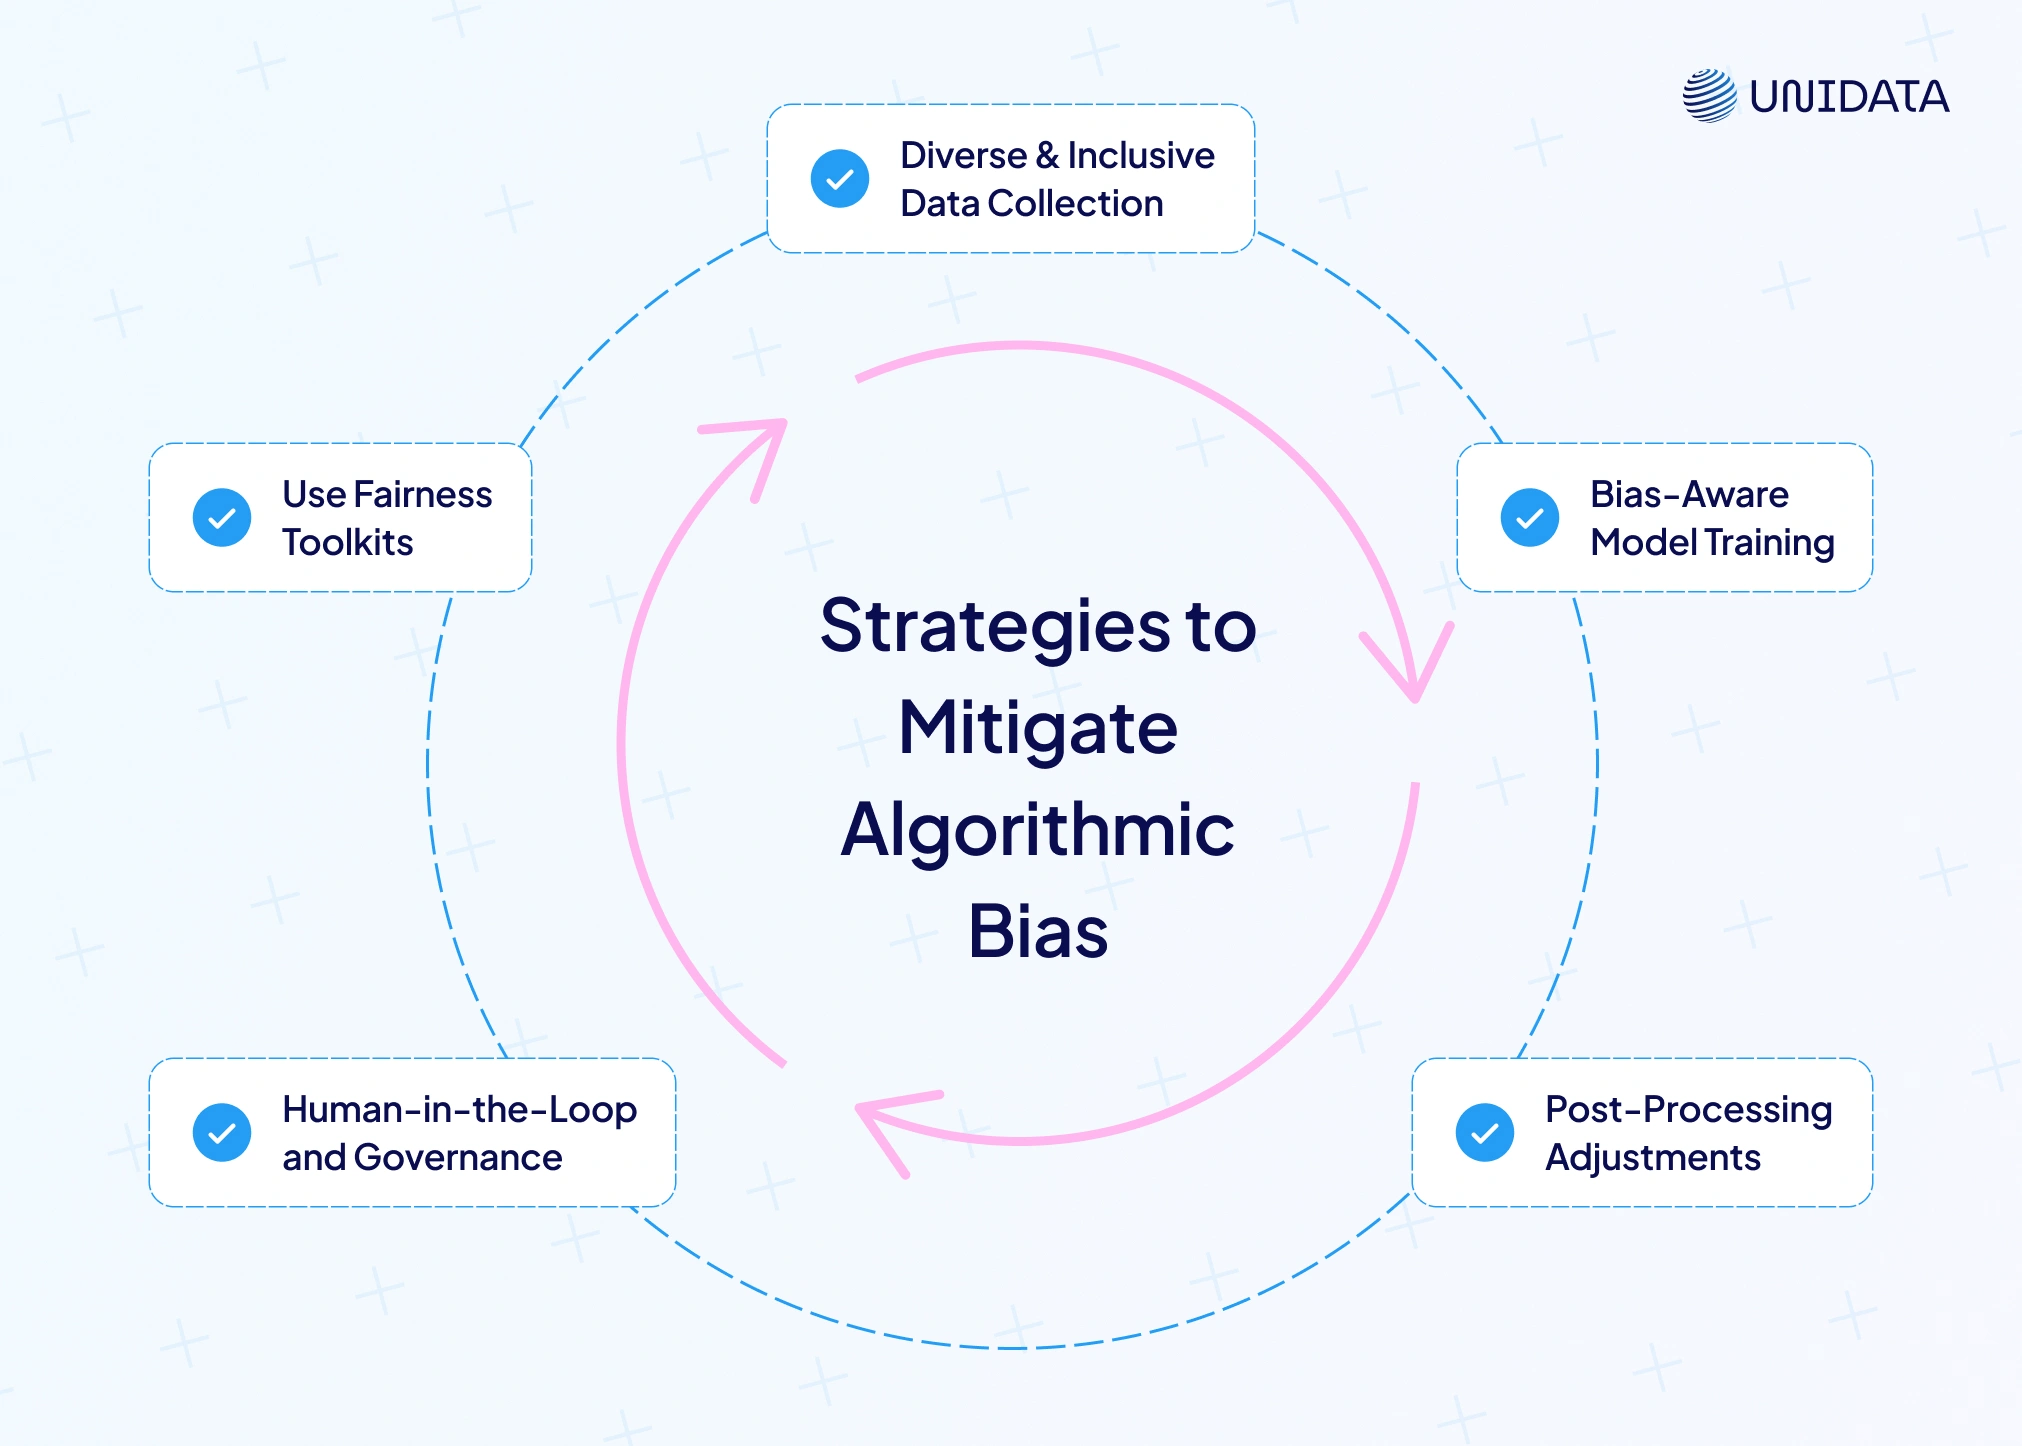
1. Diverse & Inclusive Data Collection
A fair model starts with fair data. Make sure your training data includes different demographics. If you’re serving global markets, gather local data—don’t rely on one region. Fill gaps by collecting new samples or using data augmentation. Some teams generate synthetic data, but do so carefully. As NIST notes, fairness should be a focus during data collection and preprocessing. Investing early in data diversity is cheaper than retrofitting fixes later.
2. Bias-Aware Model Training
Apply smart techniques during development:
- Reweighting or Resampling: Boost representation of smaller groups. Tools like SMOTE can help balance class size.
- Adversarial Training: Use a secondary model to detect and penalize learning of sensitive attributes.
- Fairness Constraints: Add rules that limit gaps in error rates across groups. Some libraries let you set fairness goals directly.
- Explainability: Use tools like LIME or SHAP to trace feature influence. If you detect a proxy variable (e.g., zip code = race), consider reducing its weight. Fairness through unawareness—dropping sensitive features—is one approach, but not always enough.
3. Post-Processing Adjustments
Even after training, you can reduce bias:
- Threshold Optimization: Adjust score cutoffs for each group to balance false positives and true positives.
- Score Calibration: Scale prediction scores to align model confidence across groups.
- Reject Option Optimization: For borderline predictions, favor the outcome that improves fairness.
4. Human-in-the-Loop and Governance
Bias mitigation isn’t just technical — it needs oversight:
- Diverse Team Testing: Different backgrounds catch different blind spots.
- Bias Bounties: Some firms reward users who flag unfair model behavior.
- Staff Training: Teach teams to recognize sensitive features and fairness risks.
- Ongoing Monitoring: Track model performance by segment. Bias can change as real-world data shifts. NIST recommends continuous bias checks (RSI Security).
Mitigation is always context-specific. What’s “fair” in one domain may be off-limits in another. For example, credit models may use income but not race. University admissions might allow corrective bias to level access. Whatever your case, align your strategy with the legal and ethical context.
Regular fairness audits help uncover bias early — before it reaches production. One of the most effective ways to do this is by testing models across diverse, well-annotated datasets. If your existing training data lacks coverage, you can source balanced datasets with rich metadata or commission targeted data collection through providers like Unidata, who specialize in real-world diversity.
Conclusion
Bias in machine learning can slip in quietly—like a virus—and spread unfairness fast. It can show up anywhere: in sampling, measurement, automation, or cognitive bias. Left unchecked, it damages both people and model predictions.
The good news? We have tools to fight back. Fairness metrics help detect problems. Better training data and inclusive datasets reduce bias in model predictions. Fixing bias takes effort—more data collection, smarter design, cross-functional teams. But the payoff is big: systems that perform in the real world and earn user trust.
Frequently Asked Questions (FAQ)
Main ai bias types in ai systems: sampling bias (selection bias), historical bias (prejudice), confirmation bias, and algorithmic bias. Sampling bias comes from unrepresentative training data. Historical bias comes from historical data and can drive gender bias. Confirmation bias can reinforce patterns in the criminal justice system through the data collection process. Algorithmic bias can amplify skew in the training dataset, causing inaccurate predictions in a machine learning model.
Bias and variance describe different errors in a machine learning model. High bias means the model is too simple. It underfits and makes the same mistakes across many data points. It often shows low variance. High variance means the model fits noise in the training data. It overfits and fails on new data, creating more variance errors. Managing the variance tradeoff helps improve model performance by balancing high bias and high variance in machine learning algorithms.
Selection bias happens when the training dataset is not representative. This is a data collection issue in the data collection process. Some groups are missing, so data bias occurs. The ml model is then model trained on a skewed training data set. That often leads to inaccurate predictions and unfair model’s predictions for some groups. It is closely tied to sampling bias and coverage bias.
High bias means the model cannot learn key patterns from the training data. A high bias model underfits. It produces systematic error and low accuracy, even on the training data set. It may ignore important feature values or use wrong assumptions. The result is weak model performance and stable but flawed model’s predictions across groups.
To measure bias in machine learning, check outcomes across groups using fairness metrics. You can detect bias by comparing error rates and decisions across sensitive attributes. Use metrics like demographic parity, disparate impact, equal opportunity, or equalized odds. Also audit training data for selection bias, sampling bias, and unrepresentative training data. Review labeling quality too, because measurement bias and biased data often start in data labeling. Then apply mitigation strategies for mitigating bias and track gaps over time to reduce bias in ai systems.