Supervised learning is everywhere—from the spam filter that weeds out unwanted emails to the voice assistant that transcribes your latest voice memo. It’s about teaching a model to make predictions using labeled data, much like teaching a child with the “right answers” provided. That simple but powerful concept underlies many of today’s AI breakthroughs.
In this article, we’ll break down Supervised Learning from the basics to in-depth details: how it works, its types, common algorithms, pitfalls, and where it’s making waves in surprising industries like agritech and climate modeling. We’ll also include code snippets, tables, and visual ideas to give you a solid foundation—whether you’re an ML newbie or a seasoned pro seeking fresh insights.

1. What Is Supervised Machine Learning?
At its core, Supervised Machine Learning is about learning a function from labeled training data. “Labeled” means each piece of data comes with an example of the “right answer.” For instance, if you’re teaching a system to recognize cats in images, your labeled dataset would include images, each tagged with either “cat” or “not cat.” The goal is for the model to internalize the underlying rules so that it can correctly predict labels for unseen images.
Why It’s So Widely Used
- Predictive Power: Many real-world problems come with historical data that have known outcomes—like house prices, email spam labels, or a customer’s likelihood to churn. Supervised learning leverages this existing data to build predictive models.
- Ease of Interpretation: Especially with certain algorithms (like linear regression), understanding why a model makes a prediction can be relatively straightforward. This is critical for regulated industries such as healthcare or finance, where decisions must be explainable.
- Versatility: Supervised learning covers many tasks—predicting numbers (regression), identifying categories (classification), detecting anomalies, and more.
Fun Fact: Netflix Recommendations
While recommendation systems often blend several ML techniques, supervised learning components play a big role. Netflix uses algorithms that have been trained to predict user ratings for shows and movies based on watching history and a user profile (Netflix Tech Blog). If the algorithm predicts you’ll rate a particular thriller highly, chances are it’ll pop up in your recommendations.
2. How Does Supervised Learning Work?
In supervised learning, your model starts by training on labeled data—where each example includes both the input (e.g., an image or text) and the correct, “official” answer (label). By studying these feature-label pairs, the algorithm learns how to link new inputs to the right outputs, so it can make predictions on completely unfamiliar data.
Organizing Dog Photos in Your Camera Roll

Training Phase: Suppose you have hundreds of pictures featuring your dog (and maybe your neighbor’s dog too). Each image is labeled with the correct identity—your dog vs. not your dog. Over time, the algorithm discovers the patterns (fur color, face shape, collar style) that reliably distinguish your furry friend from other canines.
Testing & Feedback: After you train the model, you show it fresh photos of dogs. Sometimes it misclassifies your neighbor’s Golden Retriever as yours. You add more photos of each dog breed, label them carefully, and tweak the model’s parameters. This feedback loop refines the system, helping it catch more subtle differences—like the particular shape of your dog’s ears.
Final Deployment: Once you’re confident in the model’s accuracy, you let it loose on your entire camera roll. It sorts out which photos have your dog in them, saving you time (and probably some embarrassment if you’ve been confusing them with the neighbor’s pup). From that point on, the system can quickly process any new dog photo you take, confidently tagging it with “your dog” or “not your dog.”
By anchoring the learning process to data with well-defined labels, supervised learning leverages past examples to make high-confidence predictions on new ones. The richer and more representative your labeled samples, the sharper and more reliable your model’s performance becomes.
3. Types of Supervised Learning
Supervised learning typically splits into two broad categories: Regression and Classification. Both revolve around finding patterns between inputs (features) and outputs (labels), but they differ in the type of output they predict.
3.1 Regression
Regression problems involve predicting a continuous value. Examples include:
- House Prices: Predicting house prices based on square footage, location, number of rooms, etc.
- Stock Market Forecasting: Estimating future stock prices given historical prices and other economic indicators.
- Weather Forecasting: Predicting tomorrow’s temperature based on historical weather data, humidity levels, and seasonal patterns.
With regression tasks, your algorithm tries to fit a function f(x) that maps input features x to a continuous output y. The aim is to minimize the difference between predicted and actual values—often using a cost function like Mean Squared Error (MSE).
3.2 Classification
Classification problems deal with predicting categorical labels. Think “which category does this input belong to?” Some classic examples:
- Email Spam Detection: Labeling emails as “spam” or “not spam.”
- Image Recognition: Identifying whether an image contains a cat, dog, or some other class.
- Sentiment Analysis: Classifying text as having “positive,” “negative,” or “neutral” sentiment.
Here, the model outputs discrete class labels, not continuous values. In many cases, you end up with a probability distribution across classes, and you pick the class with the highest probability as your final prediction.
| Aspect | Regression | Classification |
|---|---|---|
| Typical Output | A continuous value (e.g., 145,000 for house price) | A label from a set of categories (e.g., “dog,” “cat”) |
| Error Metrics | MSE, MAE (Mean Absolute Error), R-squared | Accuracy, Precision, Recall, F1 score |
| Example | Predicting temperature in Celsius | Predicting whether an email is spam or not |
| Output Interpretation | Numeric magnitude indicates how high or low an outcome is | Probability distribution over classes, or a single class label |
| Real-World Application | Forecasting sales, insurance claims, stock prices | Medical diagnosis (disease vs. no disease), image recognition |
4. Supervised Learning Algorithms
Different problems call for different algorithms, each with its strengths, weaknesses, and ideal use cases. Let’s explore some of the major players in the supervised learning arena.
k-Nearest Neighbors (k-NN)
The k-NN algorithm is as straightforward as it gets: it classifies (or regresses) a new data point based on the majority label (or average value) of its k nearest neighbors in the training set.
While easy to implement, it can become computationally expensive for large datasets, as it needs to search through all training points to make a single prediction.
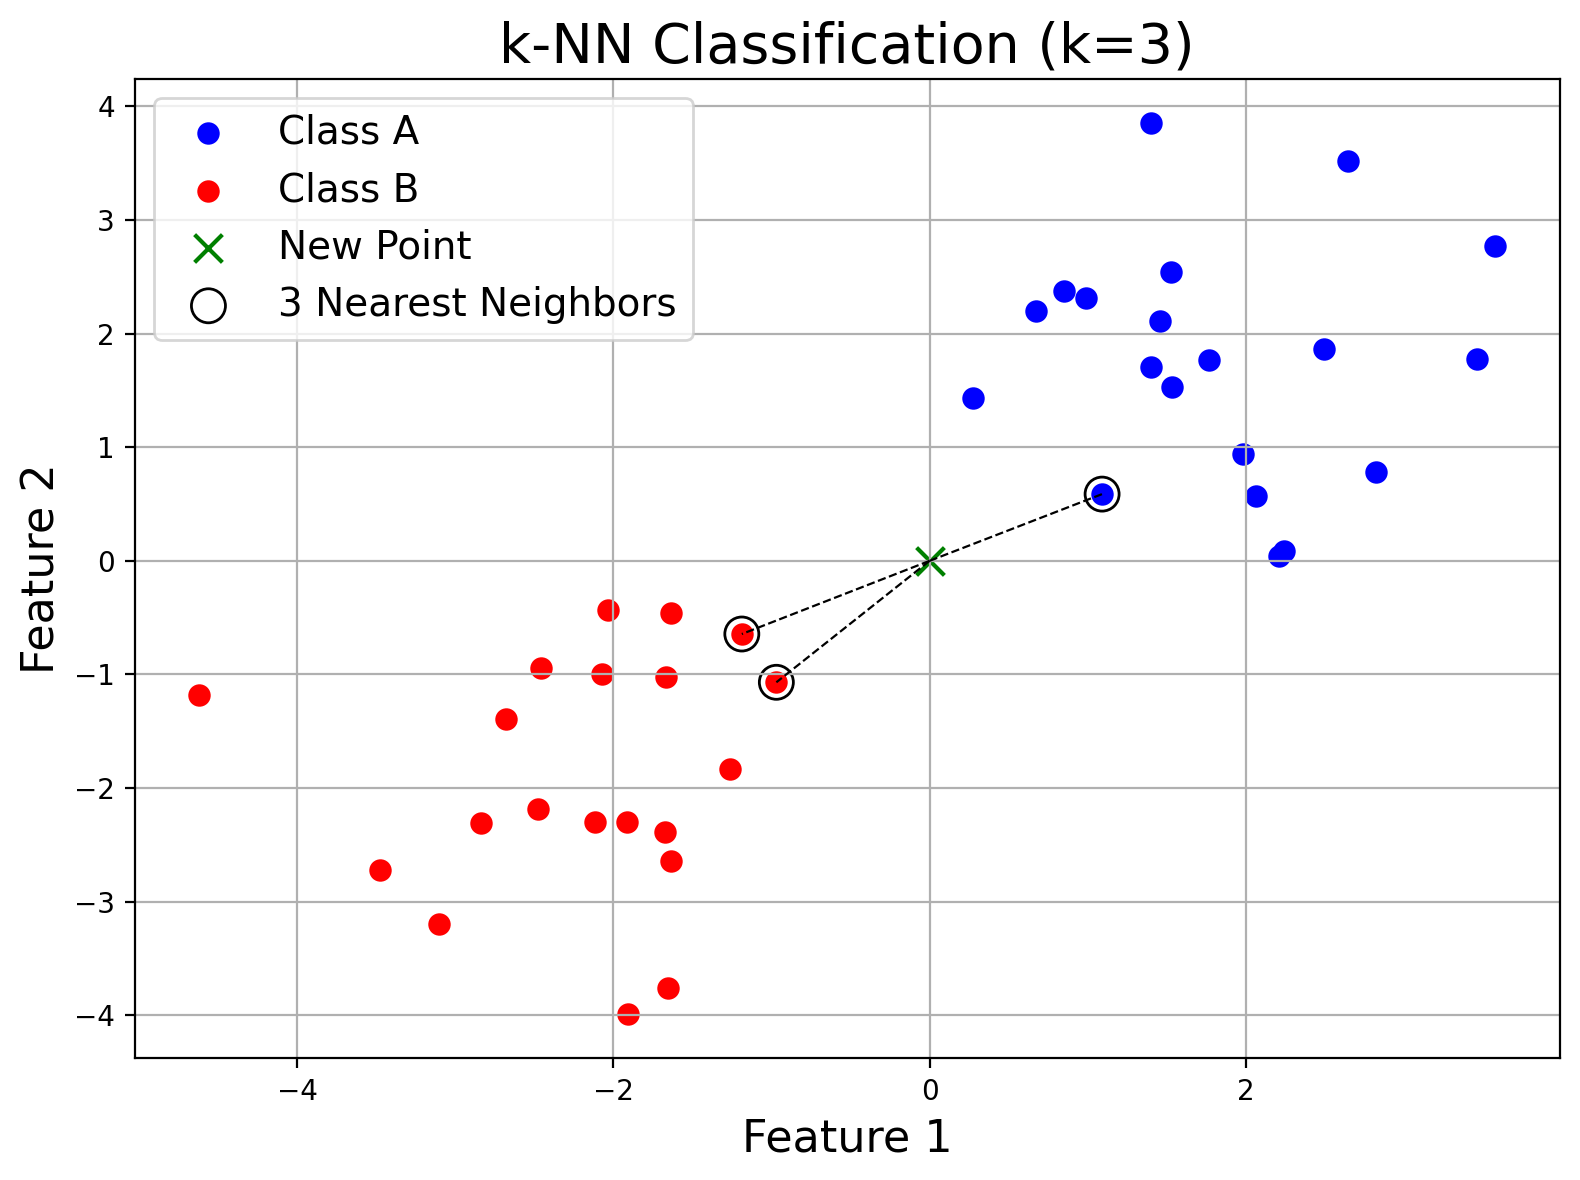
Imagine you're new in town and ask three neighbors for restaurant recommendations—two suggest Italian and one suggests a burger joint. The graph shows you (the green "x") connected to these neighbors, and you choose Italian based on the majority vote.
Linear Regression
This is often considered the “Hello World” of ML algorithms, especially for regression tasks. The model attempts to fit a straight line (or plane in higher dimensions) to the data. It’s simple, easy to interpret, and surprisingly effective for problems where the relationship between input features and output is close to linear. (Reference: The Elements of Statistical Learning.)
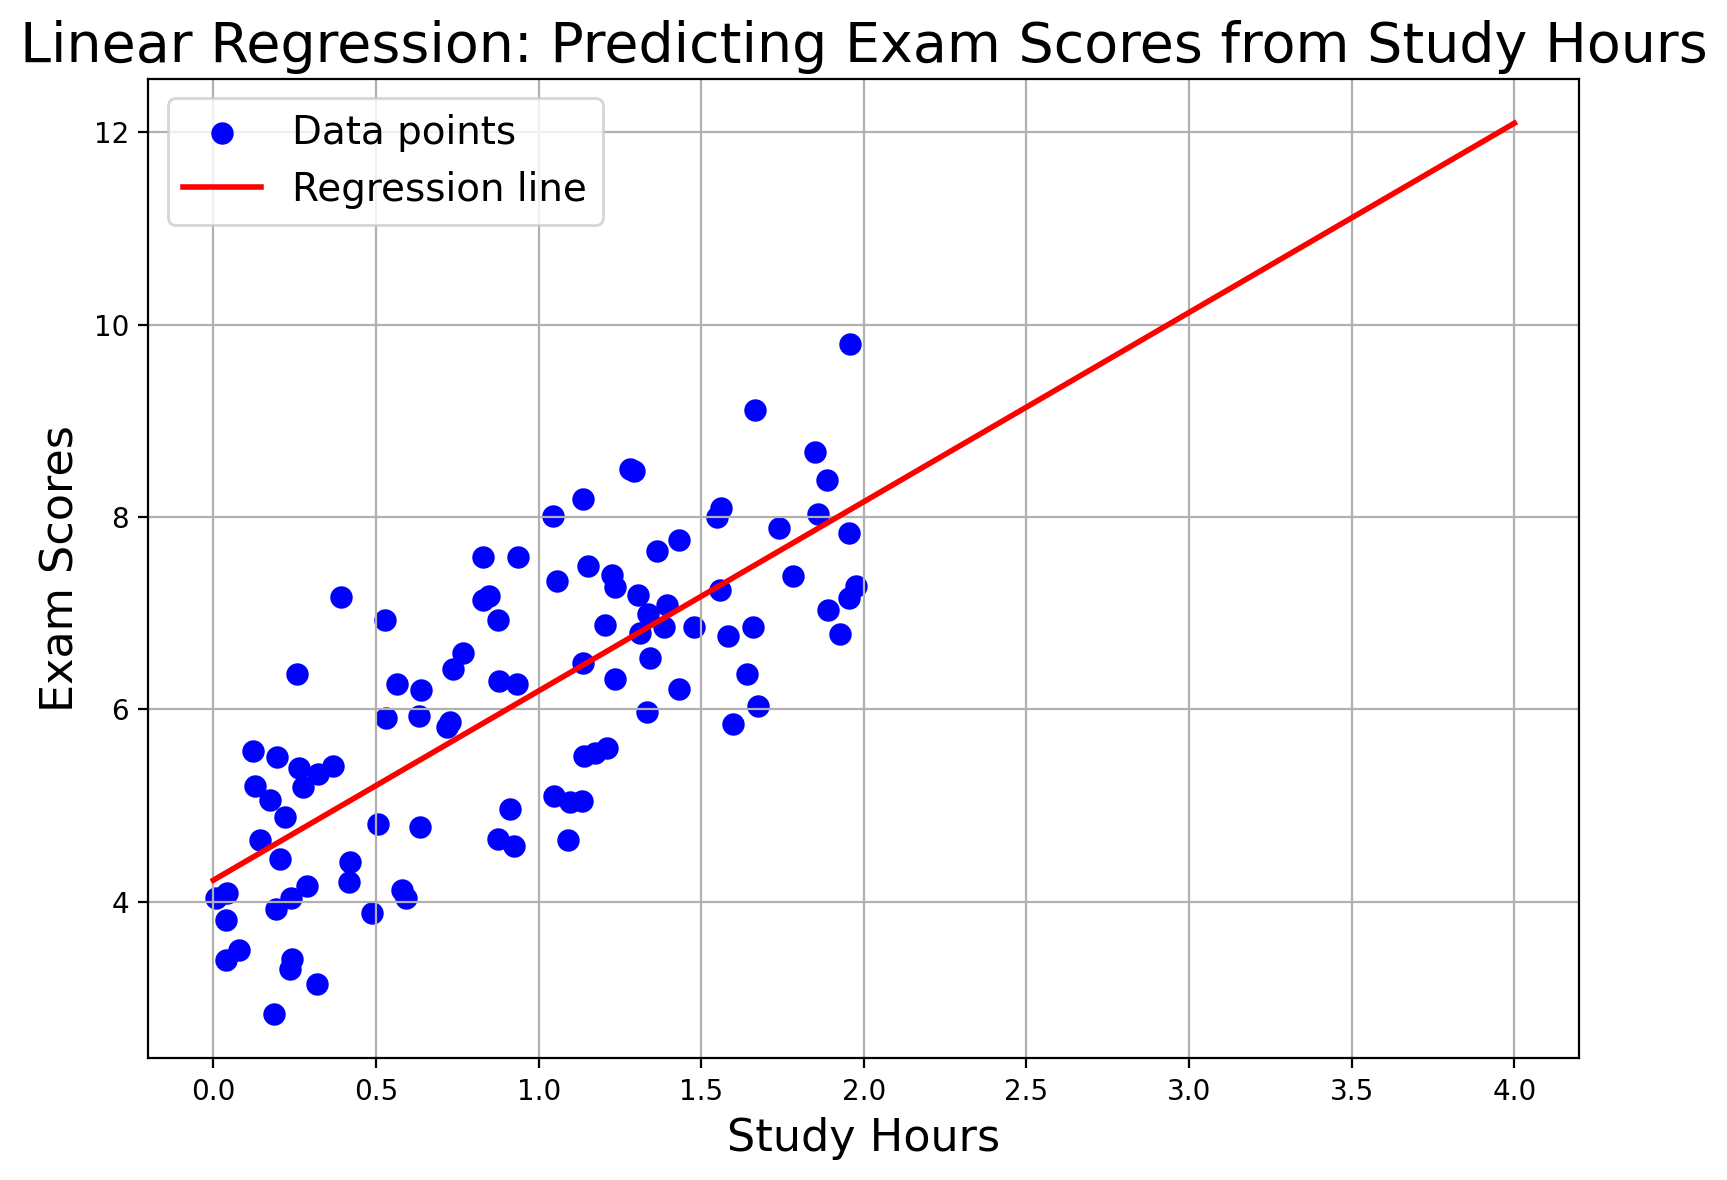
Imagine plotting your study hours versus exam scores. The red line shows the trend: more study hours generally lead to higher scores.
Logistic Regression
Don’t let the name fool you: logistic regression is primarily a classification algorithm. It outputs probabilities that a given instance belongs to a particular class (often a binary class like “spam” vs. “non-spam”). The algorithm uses a logistic function to squeeze any real-valued number into the [0,1] range. It’s widely used in medical statistics, marketing (e.g., the probability a user will click an ad), and credit scoring.
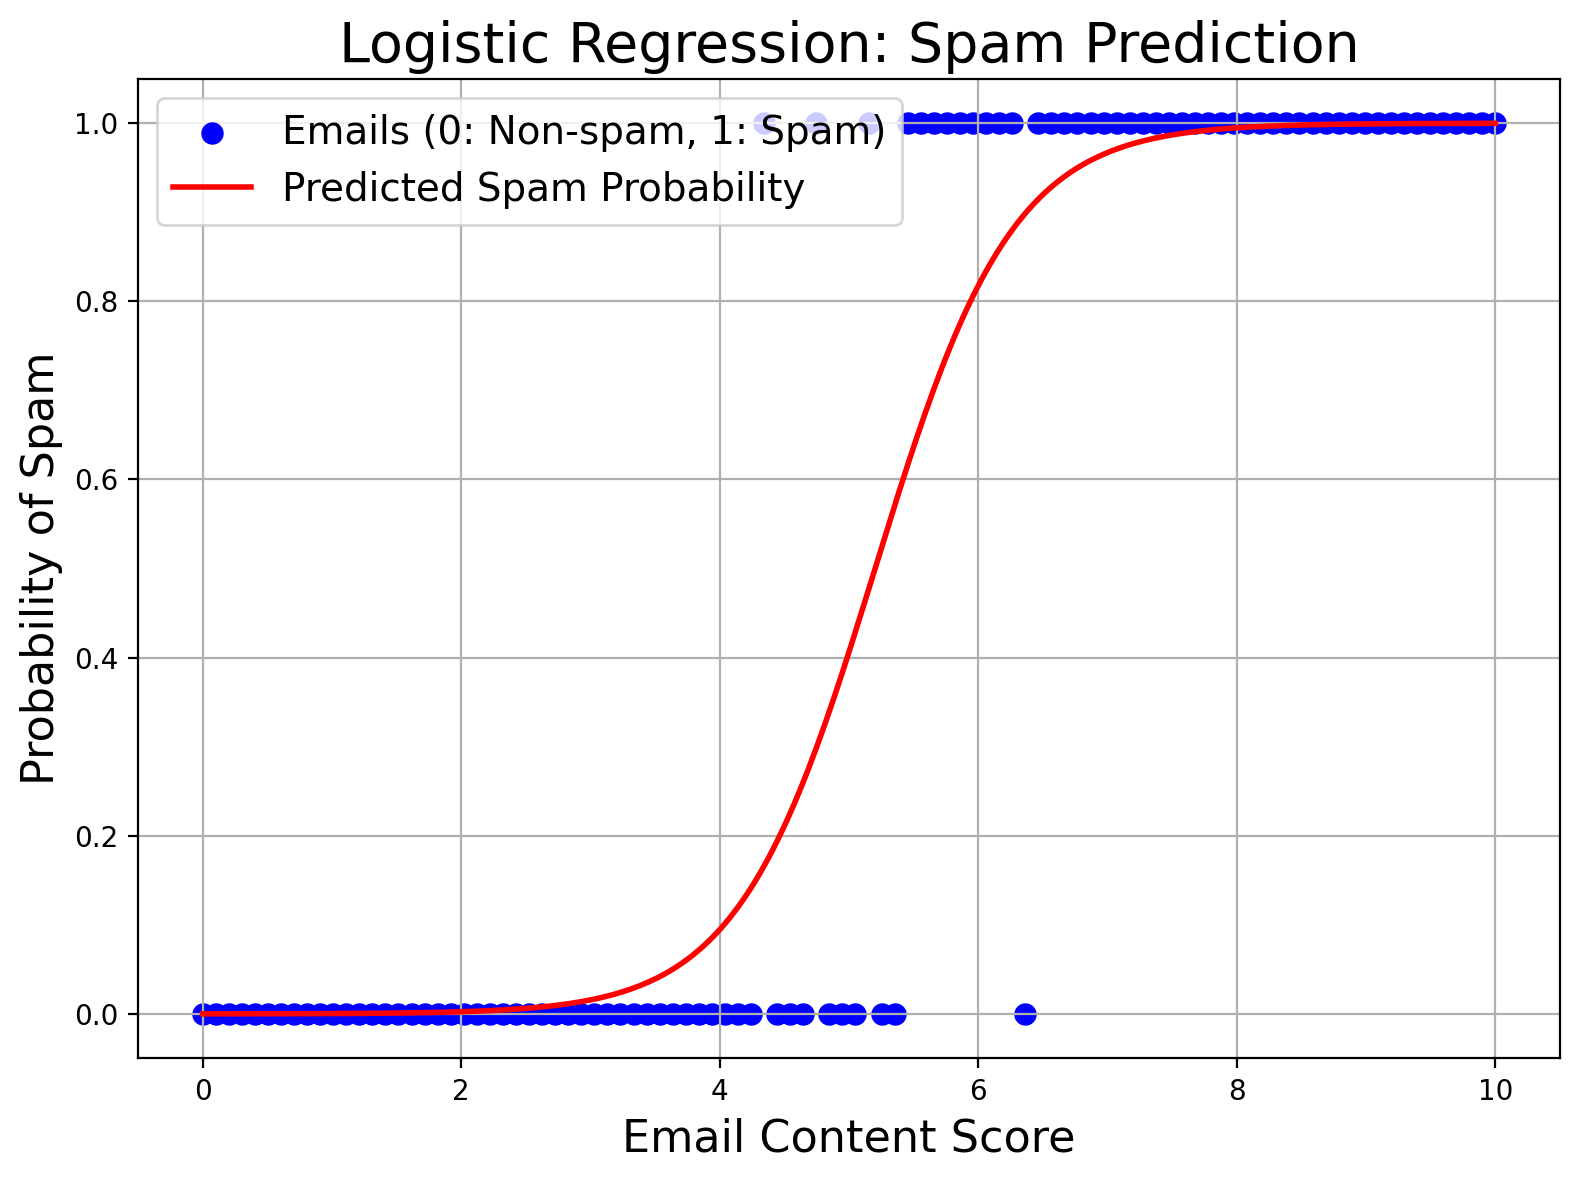
Think of sorting emails into “spam” or “not spam.” The smooth S-shaped curve represents the probability of an email being spam.
Decision Trees and Random Forests
Decision Trees split data into branches based on feature values, eventually reaching leaf nodes that represent predictions. They’re visually interpretable—resembling a flowchart. Random Forests take this idea further by training multiple (sometimes hundreds) decision trees, and then averaging their predictions. This ensemble approach often yields better accuracy and robustness.
Imagine you’re using a simple flowchart to decide whether a day is good for a picnic (Class 1) or not (Class 0) based on temperature and humidity. The graph’s colored regions represent the model’s decision (which days are predicted as picnic days vs. non-picnic days), and the scatter points are sample days with known outcomes. This visual helps you see how the decision tree partitions the feature space to classify new days:
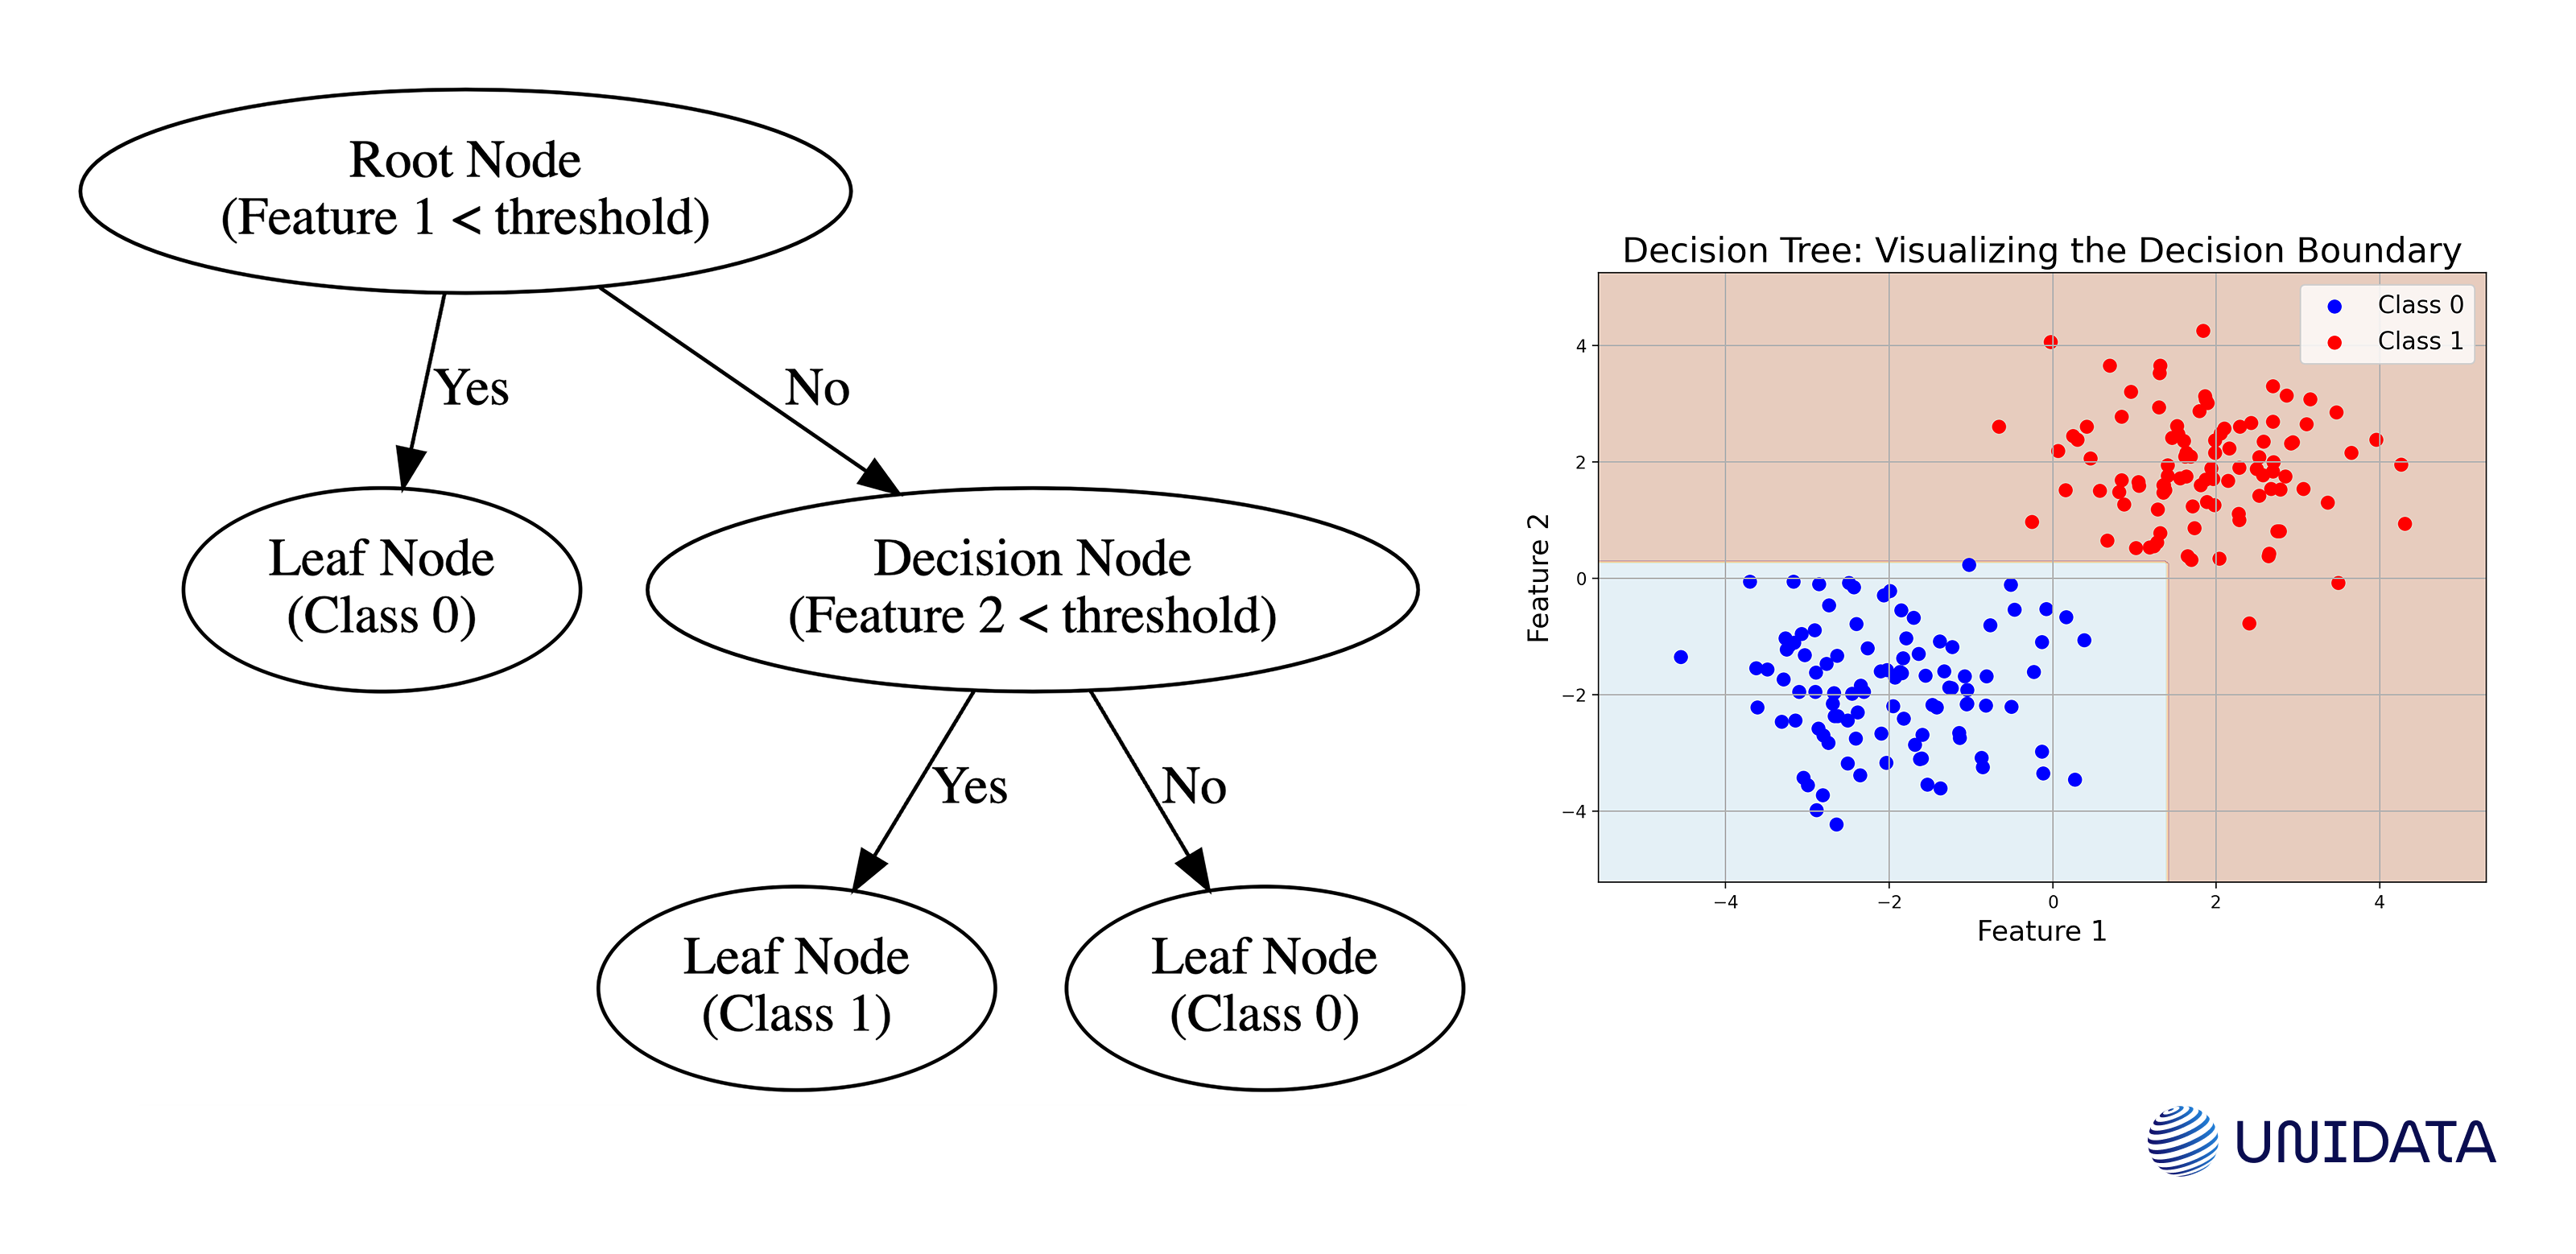
The diagram on the right shows that at the first decision (Root Node), if the temperature (Feature 1) is below a threshold, you decide it's not a picnic day (Class 0). If not, you check humidity (Feature 2) at the next decision node, where high humidity leads to a picnic day (Class 1) and low humidity to no picnic (Class 0).
Support Vector Machines (SVM)
SVM looks for a hyperplane (or set of hyperplanes in higher dimensions) that best separates the data classes, maximizing the margin between different classes. It can also be adapted for regression. SVMs often shine in high-dimensional spaces and can model complex relationships with the help of kernel functions.
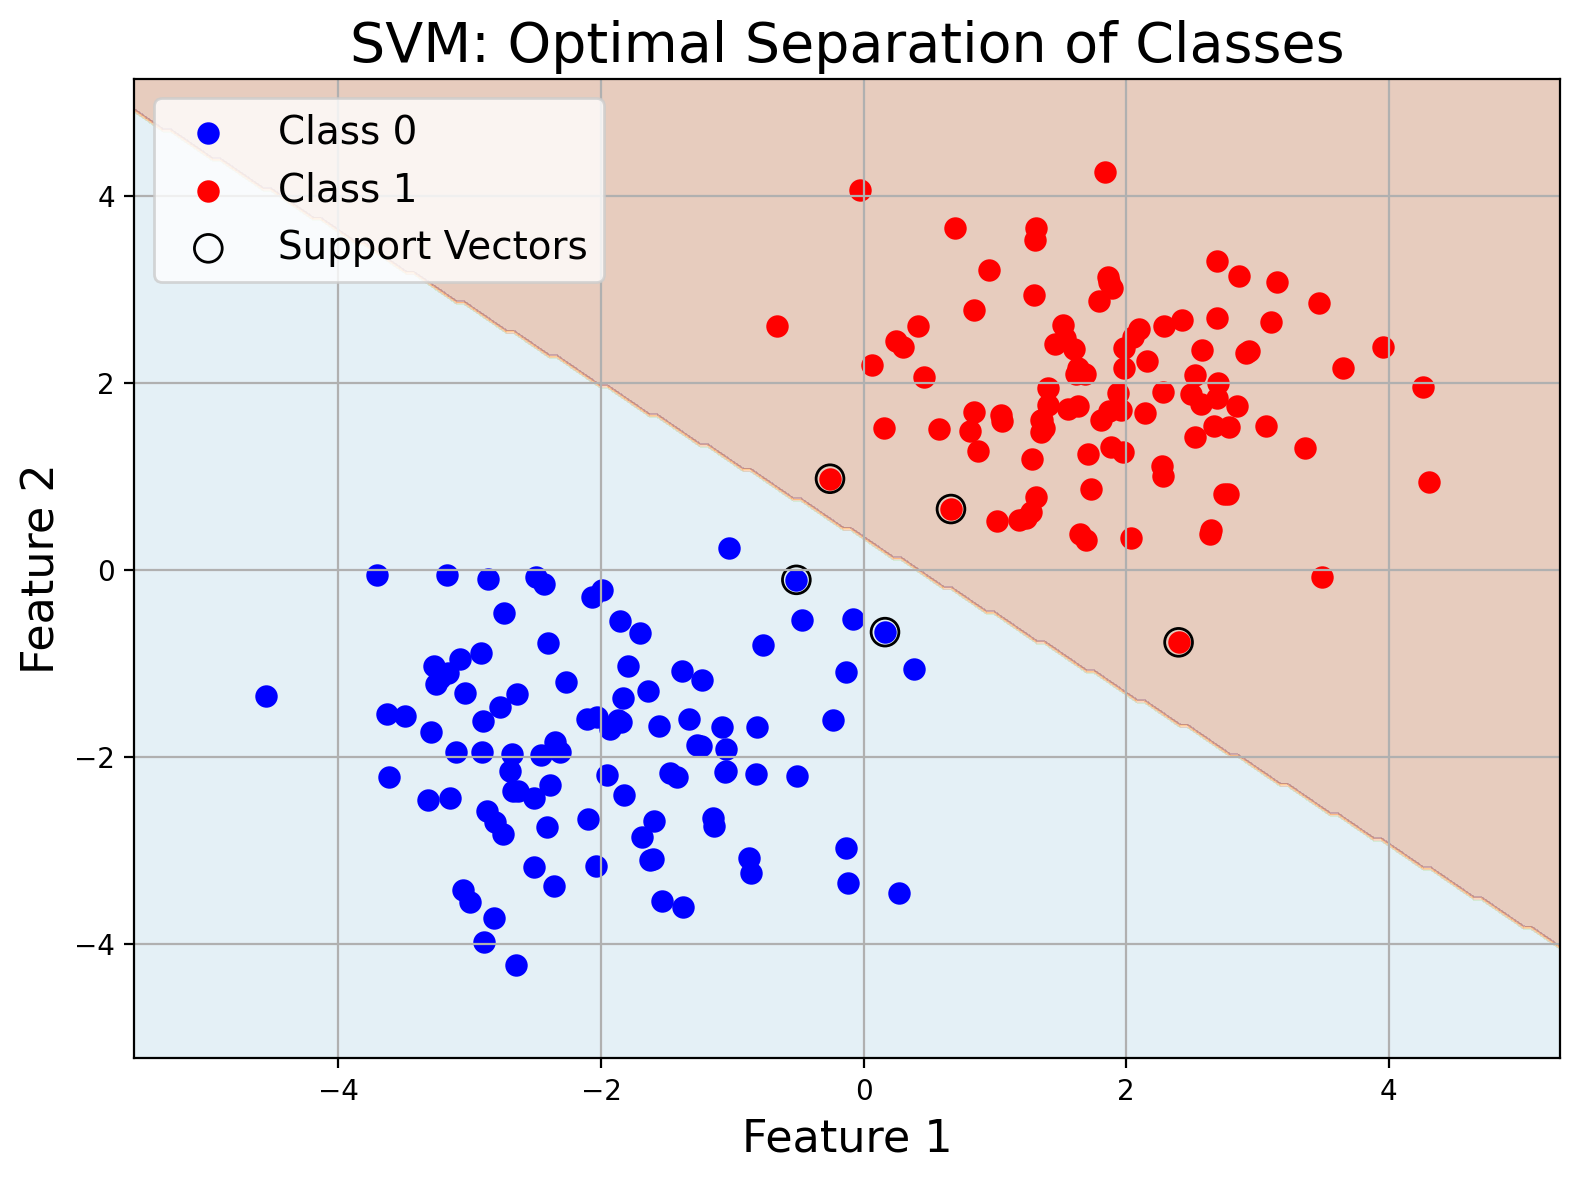
Imagine drawing a line in a park to separate two groups of friends. SVM finds the best line (hyperplane) that maximizes the gap between the groups.
Ensemble Methods (Boosting and Bagging)
We’ve already met Random Forests (a type of bagging method). Another popular ensemble method is Gradient Boosting, where multiple weak learners (often decision trees) are trained in a sequential manner, each one aiming to correct the errors of the previous. XGBoost, LightGBM, and CatBoost are industrial-grade implementations that frequently win machine learning competitions (Kaggle Leaderboards).
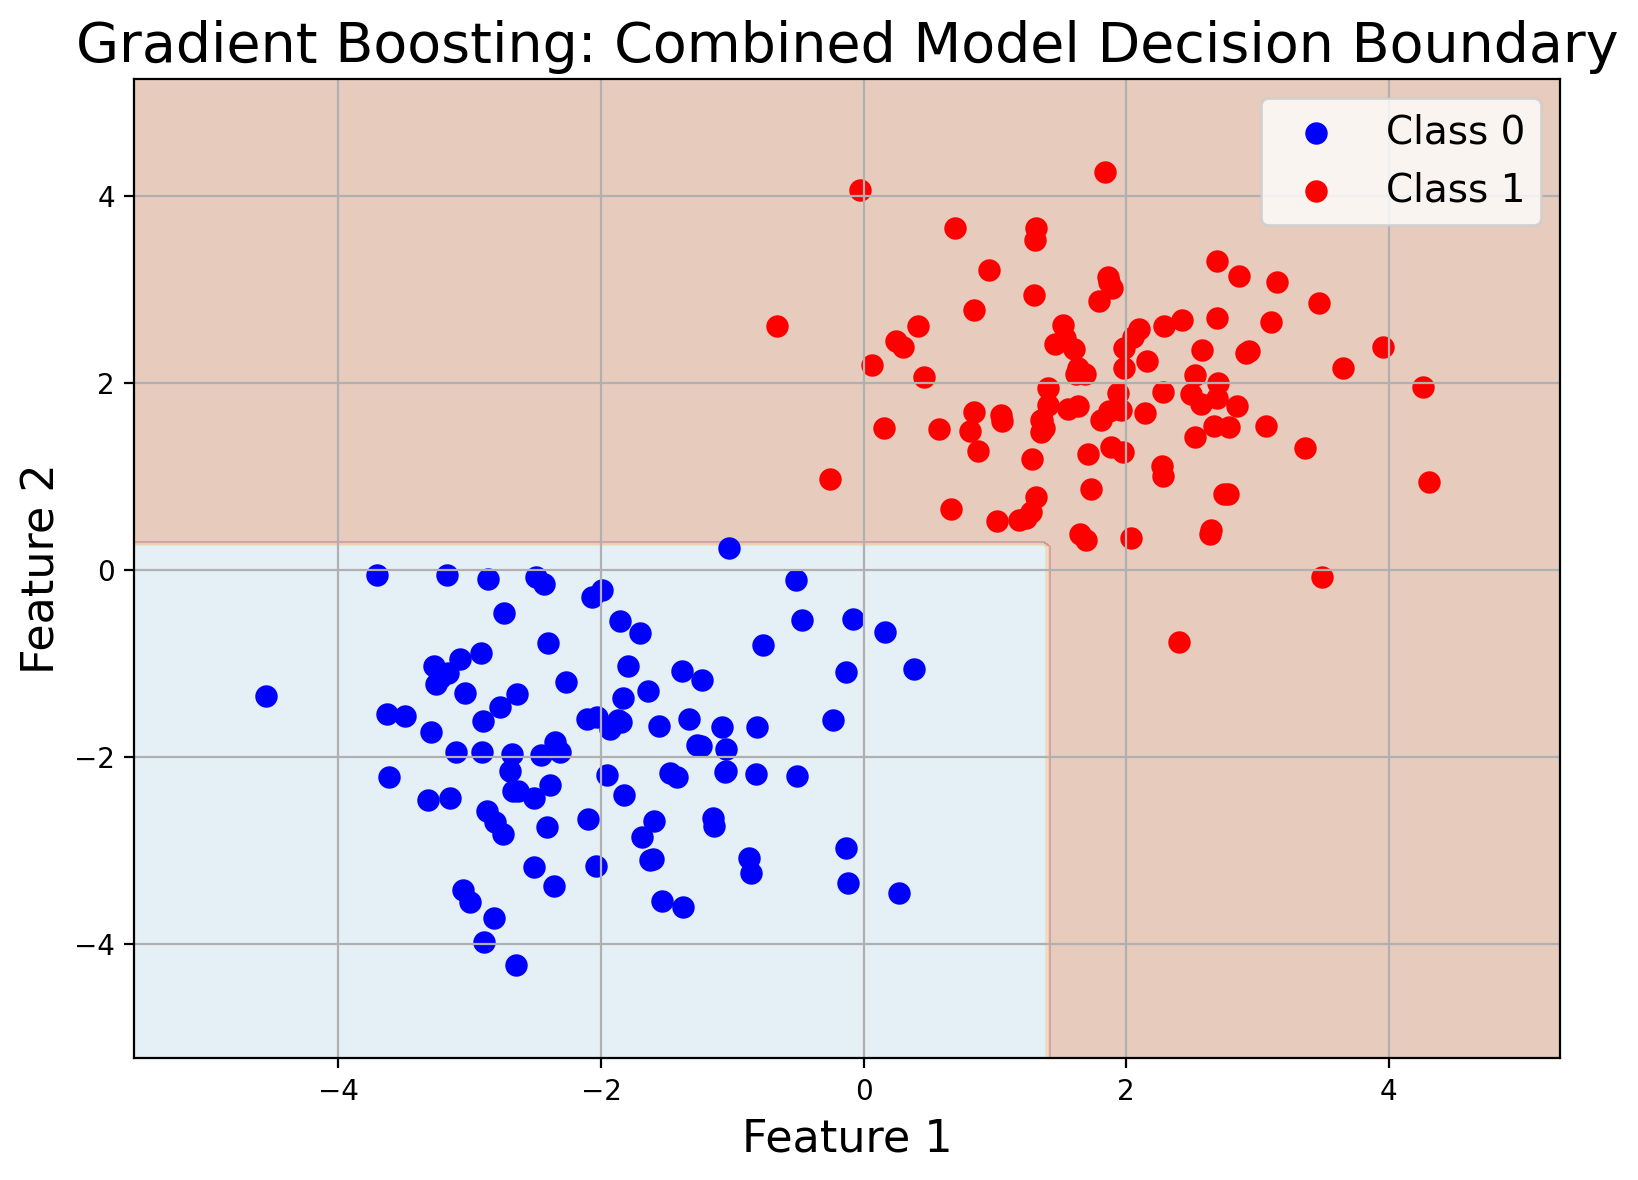
Imagine asking several friends for restaurant recommendations, and then choosing the most common suggestion. Ensemble methods combine many models’ decisions to improve accuracy.
Neural Networks
From simple Multi-Layer Perceptrons (MLPs) to Deep Neural Networks, these models draw inspiration from the human brain. Each layer progressively extracts higher-level features from the data. Deep neural networks have revolutionized fields like image recognition, natural language processing, and speech recognition, but they often require large datasets and computational power.
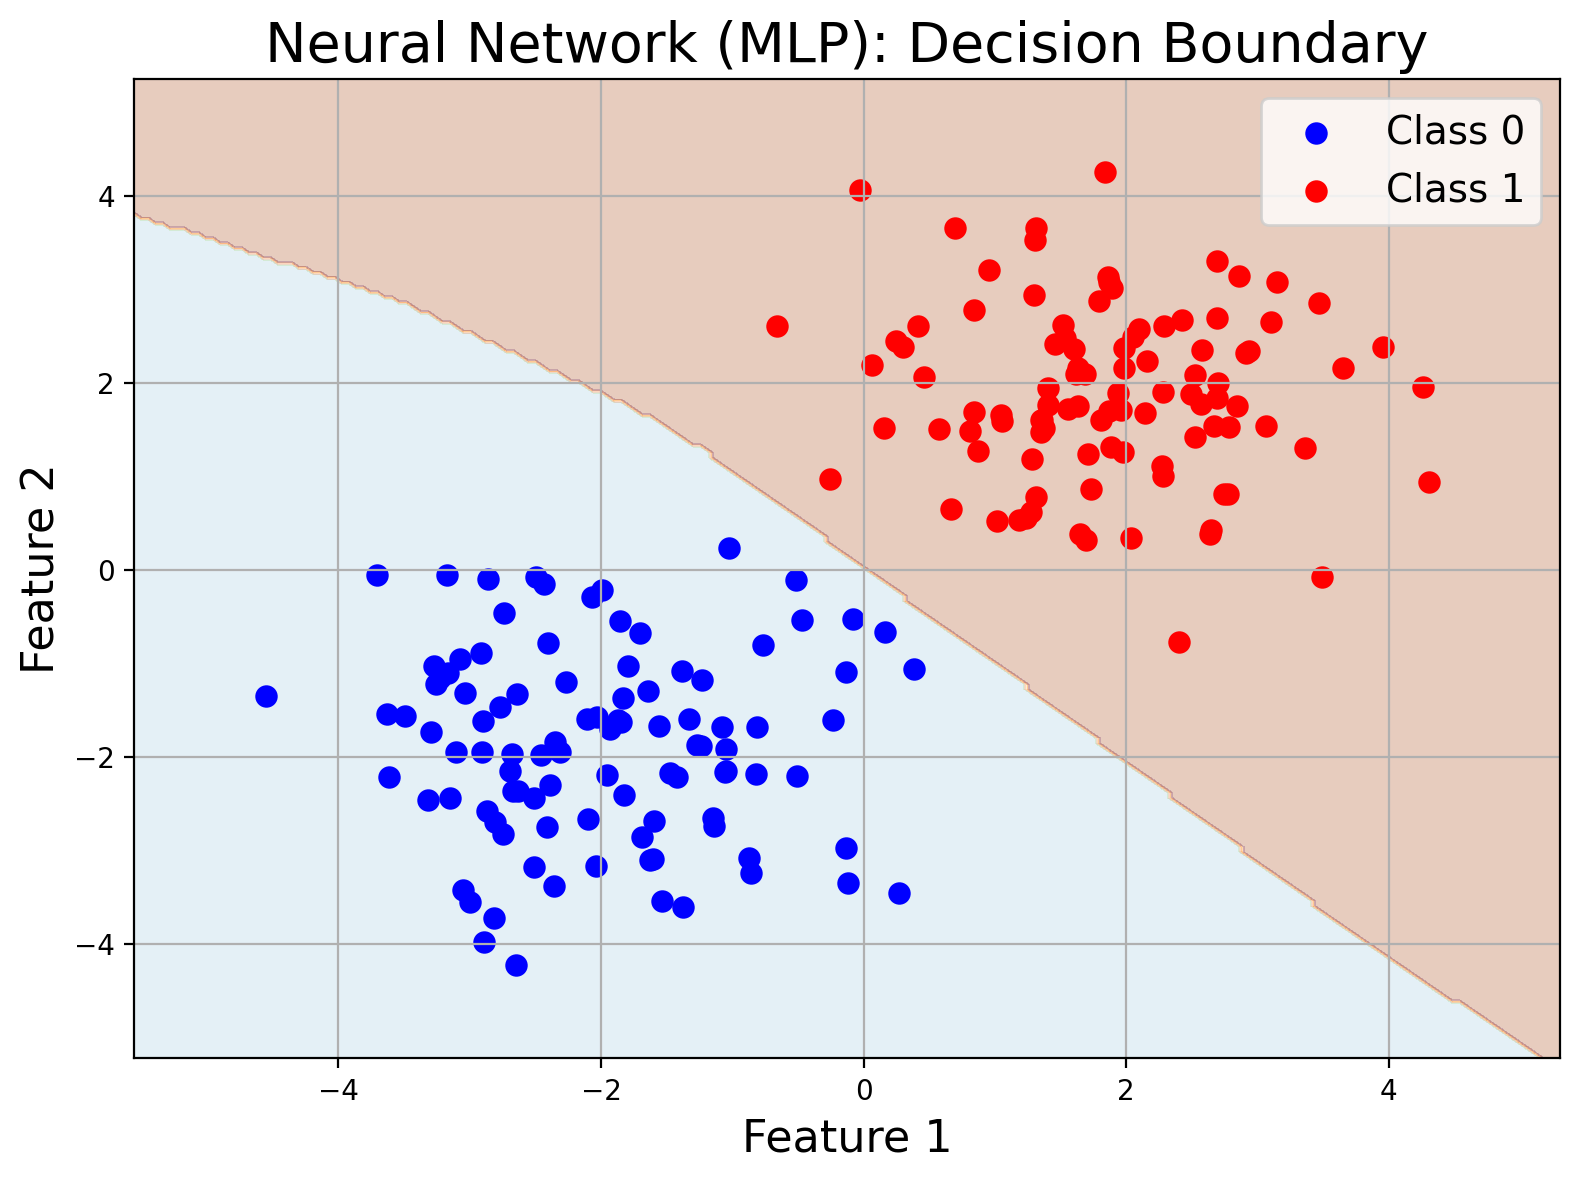
Think of a series of interconnected filters that gradually extract features from an image to recognize faces. A simple neural network (MLP) classifies data by learning complex patterns.
Quick Algorithm Cheat Sheet
Below is a streamlined table comparing some popular supervised learning algorithms. This can help you decide which tool fits your situation:
| Algorithm | Typical Use Cases | Pros | Cons | Data Size Req. | Interpretability | Complexity |
|---|---|---|---|---|---|---|
| k-NN | Recommendation systems, anomaly detection | Simple, no explicit training phase | Slow predictions with large datasets | Small to Medium | High (conceptually) | Low for training, high at predict |
| Linear Regression | House pricing, trend forecasting | Easy to interpret, simple to train | Assumes linear relationships, sensitive to outliers | Moderate to Large | High (coefficients) | Low (fast training) |
| Logistic Regression | Binary classification (spam vs. not spam) | Outputs probabilities, interpretable | Limited to linear decision boundaries | Moderate to Large | High | Low |
| Decision Trees | Customer churn, credit risk analysis | Interpretable, handles non-linear | Prone to overfitting without pruning | Small to Moderate | High (visual flow) | Low to Moderate |
| Random Forest | Medical diagnosis, fraud detection | High accuracy, robust | Harder to interpret, can be slower | Medium to Large | Moderate | Medium (multiple trees) |
| SVM | Image recognition | Good with high-dime | Choosing the right kernel can be tricky | Medium to Large | Low to Medium | Medium to High (esp. w/ kernels) |
| Neural Networks | Image/speech recognition, NLP | Very powerful, can model complex data | Requires large data and compute | Large to Very Large | High (conceptually) | High (GPU/TPU often required) |
Use this chart as a quick reference when deciding on an algorithm. Consider how much data you have, your interpretability needs, and how complex your patterns are.
A Mini Hands-On Walkthrough
Let’s do a quick classification example using scikit-learn in Python, demonstrating the typical steps.
# Step 1: Import Libraries
import numpy as np
from sklearn.model_selection import train_test_split
from sklearn.ensemble import RandomForestClassifier
from sklearn.metrics import accuracy_score

# Step 2: Create a Toy Dataset
# Features: [Hours_Studied, Hours_Slept], Label: Pass(1)/Fail(0)
X = np.array([[2, 7], [3, 6], [10, 8], [12, 5], [1, 4], [9, 7]])
y = np.array([0, 0, 1, 1, 0, 1])

# Step 3: Split Data
X_train, X_test, y_train, y_test = train_test_split(X, y, test_size=0.3, random_state=42)

# Step 4: Train Model
model = RandomForestClassifier(n_estimators=10, random_state=42)
model.fit(X_train, y_train)

# Step 5: Predict & Evaluate
y_pred = model.predict(X_test)
accuracy = accuracy_score(y_test, y_pred)
print("Test Accuracy:", accuracy)
Outline of Each Step:
- Data Splitting: We reserve 30% of data for testing.
- Model Training: We pick a random forest classifier with 10 trees.
- Prediction & Evaluation: We measure accuracy on the withheld test set.
That’s it—our tiny pipeline in a nutshell.
5. Other Learning Methods
While supervised learning is prevalent, it’s not the only game in town. Depending on your problem, data availability, and objectives, other approaches might fit better.
Unsupervised Learning: This focuses on unlabeled data. The model tries to find hidden structures—like grouping customers into segments or discovering patterns in complex datasets. Common methods include clustering (e.g., K-means) and dimensionality reduction (e.g., PCA).
Reinforcement Learning (RL): Inspired by behavioral psychology, RL involves an agent learning to achieve a goal in an environment by maximizing cumulative rewards. Think of a robot learning to navigate a maze or an AI system mastering complex strategy games like Go or StarCraft (reference: DeepMind Research).
Semi-Supervised and Self-Supervised Learning: These methods leverage large volumes of unlabeled data alongside a small amount of labeled data. Semi-supervised learning is common when obtaining labels is expensive or difficult. Self-supervised learning, famously employed in language models like GPT, uses pretext tasks (e.g., predicting masked words) to learn rich data representations without labeled data.
Each of these methods can be incredibly useful depending on the context. For example, if you have a massive dataset with very few labels, unsupervised or semi-supervised techniques might help you extract insights more efficiently than purely supervised approaches.
6. Pitfalls to Watch Out For
Even well-designed systems can stumble. Here are some common traps:
- Overfitting
The model memorizes training examples rather than learning generalizable patterns.
For instance, a fraud detection model might perfectly classify known fraudulent transactions but fail to flag new tactics criminals use.
- Underfitting
The model is too simple (e.g., a linear model for a highly non-linear problem).
Result: Poor performance on both training and test sets.
- Data Leakage
Occurs when information from outside the training dataset is inadvertently used to create the model, leading to artificially inflated performance.
For example, a dataset for predicting loan defaults that includes a feature inadvertently correlated with future repayment status.
- Mismatch Between Training and Production Data
Imagine building a model to detect fraudulent credit card transactions. If fraudsters shift tactics or a new event changes spending patterns drastically, your old training data may be obsolete, missing fresh trends.
Continuous data monitoring and model retraining are crucial.
By proactively checking for these pitfalls—through cross-validation, robust data pipelines, and frequent performance monitoring—you can guard against nasty surprises once your model is live.
Validation Dataset in Machine Learning
Learn more
7. Industry Applications
While we often hear about spam detection or stock price predictions, supervised learning reaches into a variety of fascinating, sometimes unexpected domains:
Agritech: Models can predict crop yields by analyzing satellite imagery, weather data, and soil conditions. According to a 2022 study, advanced ML models improved yield prediction accuracy by as much as 30% in certain regions (FAO Report).
Climate Modeling: Researchers feed historical climate and environmental data into supervised models to forecast temperatures, rainfall patterns, and even the progression of certain climate phenomena. This helps policymakers and communities prepare for extreme weather events.
Cutting-Edge Biotech: Supervised models assist in drug discovery by predicting how different molecular compounds might interact or by analyzing genomic data to identify disease markers.
Wildlife Conservation: Image recognition models are trained to track animal populations, identifying species from camera-trap footage. This helps conservationists protect endangered species and allocate resources effectively.
Predictive Maintenance: Factories collect sensor data from machinery and use supervised learning to predict when a component is likely to fail (reference: Deloitte whitepaper on Predictive Maintenance). This helps schedule repairs before breakdowns occur, saving millions in unplanned downtime.
These examples highlight how versatile supervised learning can be when fed high-quality, domain-specific data.
8. Pros and Cons of Supervised Learning
Every coin has two sides, and supervised learning is no exception. Here’s a balanced look at its advantages and drawbacks.
Pros
- High Accuracy: When plenty of high-quality labeled data is available, supervised learning models often yield highly accurate predictions.
- Interpretability: Methods like linear or logistic regression are relatively easy to interpret, helping you understand why certain predictions are made—a critical factor in regulated sectors.
- Versatility: Whether you’re labeling texts, images, financial data, or any structured dataset, supervised learning provides a wide array of algorithms to tackle the problem.
- Clear Evaluation: Since the correct labels are known, you can quickly measure how well your model is doing, making the iterative improvement process straightforward.
Cons
- Data Labeling Cost: Quality labeled data doesn’t come cheap. Collecting and annotating large datasets can be time-consuming and expensive.
- Limited Adaptability: Models may become stale when real-world conditions shift (concept drift). Retraining is crucial, but that requires continuous data labeling and frequent iteration.
- Bias Issues: If the training data is biased, the model will inherit and even amplify those biases. For instance, a facial recognition system trained mostly on lighter-skinned faces may perform poorly on darker-skinned faces (Gender Shades Project).
Keep in mind that mitigating these cons often requires not just technical know-how but also ethical considerations, domain expertise, and continual monitoring. The steps you take to ensure data quality, fairness, and model interpretability significantly shape your project’s success or failure.
Conclusion
Supervised learning is a workhorse of AI, driving real-world solutions across a mosaic of industries. From predicting machinery breakdowns in manufacturing to analyzing wildlife populations in remote habitats, it’s proven both versatile and powerful. Yet success hinges on meticulous data gathering, robust model selection, and ongoing vigilance against pitfalls like overfitting and data drift.
Approach it with the right balance of technical rigor and ethical care, and supervised learning can deliver transformative results—whether you’re saving endangered species or simply filtering out spam emails more reliably. Keep refining, keep experimenting, and watch as your supervised models evolve into ever more accurate, efficient, and responsible AI tools.