What is a 3D Point Cloud?
Imagine you're looking at a sculpture — but instead of marble, it's made of millions of suspended dots. Each dot marks an exact point in space, capturing the shape of a real object. That’s a 3D point cloud.
Technically, a point cloud is a set of (X, Y, Z) coordinates collected by sensors that scan real-world environments. These dots form the raw geometry behind 3D modeling — used in architecture, robotics, autonomous driving, and more.
Think of them as spatial breadcrumbs that, when connected, recreate the structure of the physical world with surprising fidelity.
Methods of 3D Point Cloud Acquisition
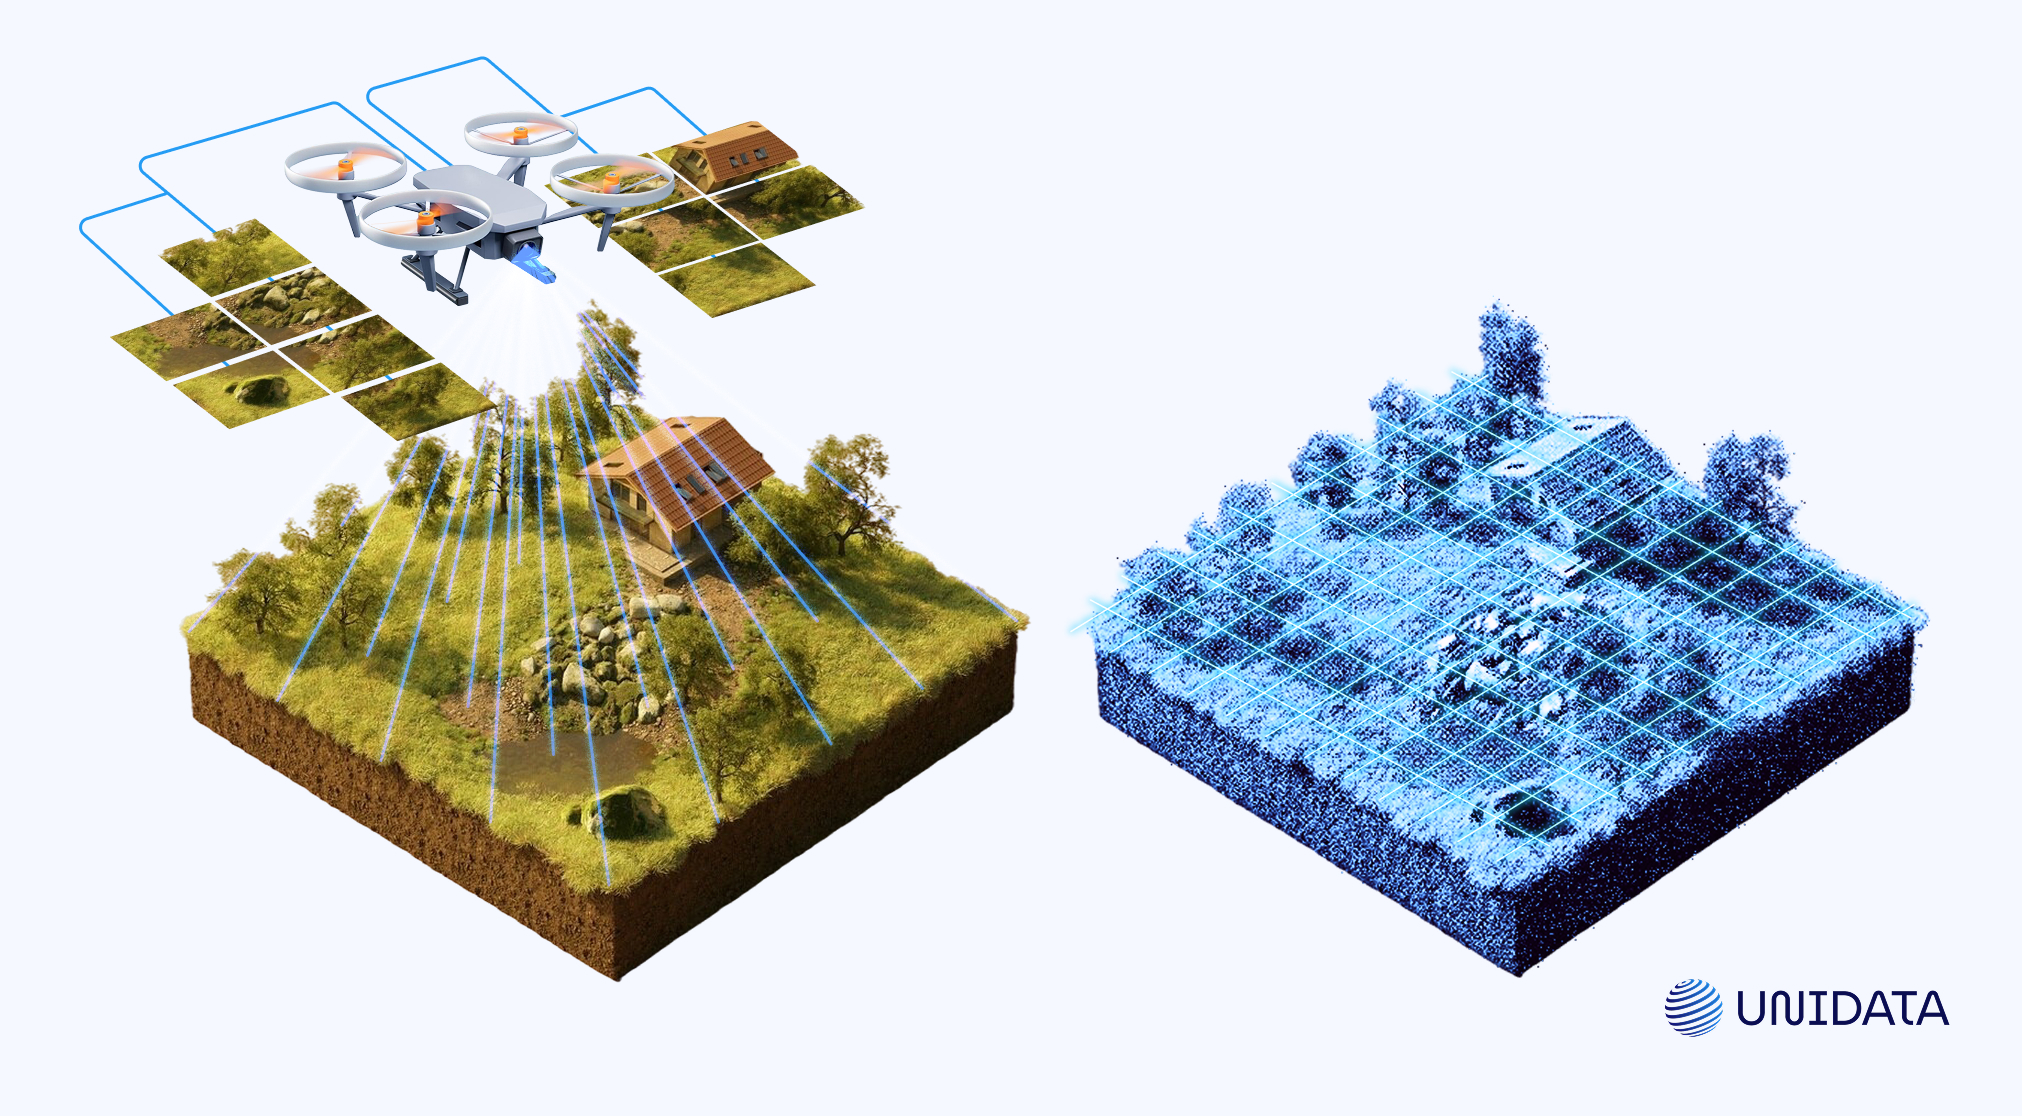
Before a 3D model can come to life, we need to collect the raw data — the point cloud. That data doesn’t just appear out of thin air. It’s captured using special tech designed to scan the world around us.
There are three main ways to do this: LiDAR, Photogrammetry, and Structured Light. Each method sees the world differently. Some are better outdoors. Some are more affordable. Some are precise enough to spot tiny details on a screw.
Let’s explore how they work, where they shine, and where they fall short.
LiDAR: Laser Scanning in the Fast Lane
LiDAR stands for Light Detection and Ranging. It works like this: a device shoots out thousands of laser pulses every second. Those pulses hit objects, bounce back, and tell the system how far away everything is. The result? A super-detailed 3D map made entirely from points.
This method is a favorite in industries that need speed and precision. For example:
- Self-driving cars use spinning LiDAR sensors to detect people, road signs, and obstacles — even in the dark.
- Civil engineers use it to scan construction sites or map forests from planes and drones.
LiDAR is very accurate. It works in low light and covers large areas quickly. But it's not perfect. It can get confused by shiny or transparent surfaces like glass. The hardware is also pricey and bulky. Plus, all that detail creates huge files, so you’ll need powerful machines to process the data.
Photogrammetry: Turning Photos into 3D Models
Photogrammetry is a bit like puzzle-solving with pictures. Instead of shooting out lasers, it takes lots of photos from different angles. Then, software finds common points in those photos and builds a 3D shape by connecting the dots.
It’s a great choice when you want both shape and texture. You’ll find it used in:
- Archaeology, where researchers recreate ruins or artifacts without touching them.
- Game development and movies, where artists turn real objects into lifelike digital models.
- Architecture, for creating digital copies of buildings using drone photos.
You don’t need fancy gear — just a good camera and the right software. That makes it affordable and accessible.
But it’s slower than LiDAR. It also depends on having good lighting and sharp, clear textures. Smooth or shiny surfaces can throw it off. And processing all those photos into a single 3D model can take hours — or even days.
Structured Light: High Detail in Tight Spaces
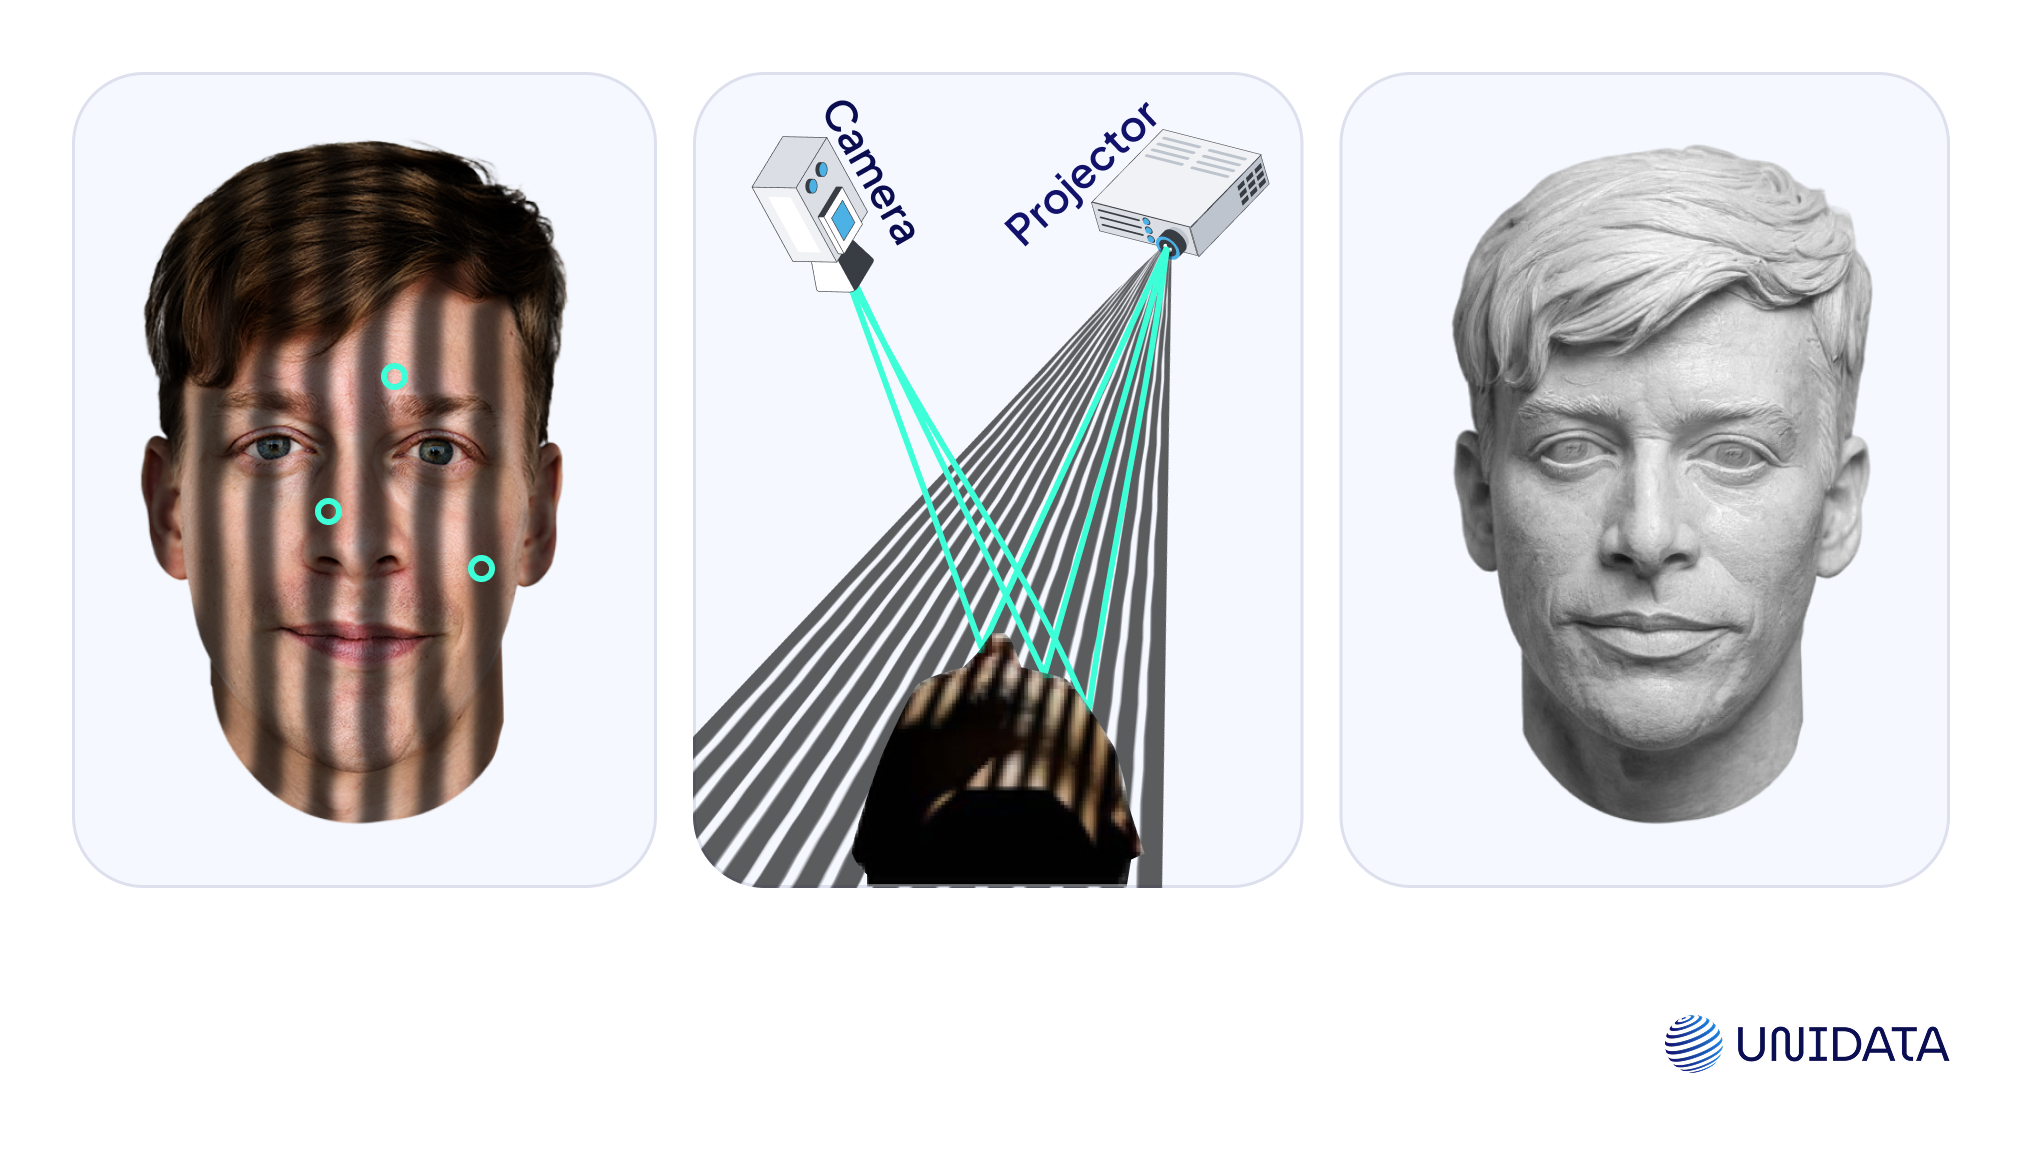
Structured light scanning works by projecting patterns — like grids or stripes — onto an object. A camera watches how those patterns bend and stretch across the surface. Then, the software figures out the shape based on how the pattern changed.
This method captures small details really well. It’s used when accuracy matters most, like:
- Manufacturing, to check if a part was made correctly down to the tiniest detail.
- Medical tech, for scanning body parts and creating custom prosthetics or wearables.
It’s fast and precise. But there’s a catch. Structured light doesn’t work well in bright or outdoor settings. It’s best in labs or studios where the lighting can be controlled. Also, it only works at close range — so you can scan a shoe, but not a skyscraper.
Each method has its own strengths. LiDAR is built for speed and outdoor scanning. Photogrammetry gives you rich visuals at a low cost. Structured light is the go-to for super-high detail in tight spaces.
Processing Pipelines & Industry Formats
Capturing a 3D point cloud is just the beginning. What comes next is where the magic — and the mess — really happens. Before you can use a point cloud for modeling, machine learning, or simulation, it needs to be cleaned, aligned, and shaped into something workable.
Let’s walk through the steps one by one. Don’t worry — it’s simpler than it sounds.
From Raw Scan to Ready-to-Use: Step-by-Step
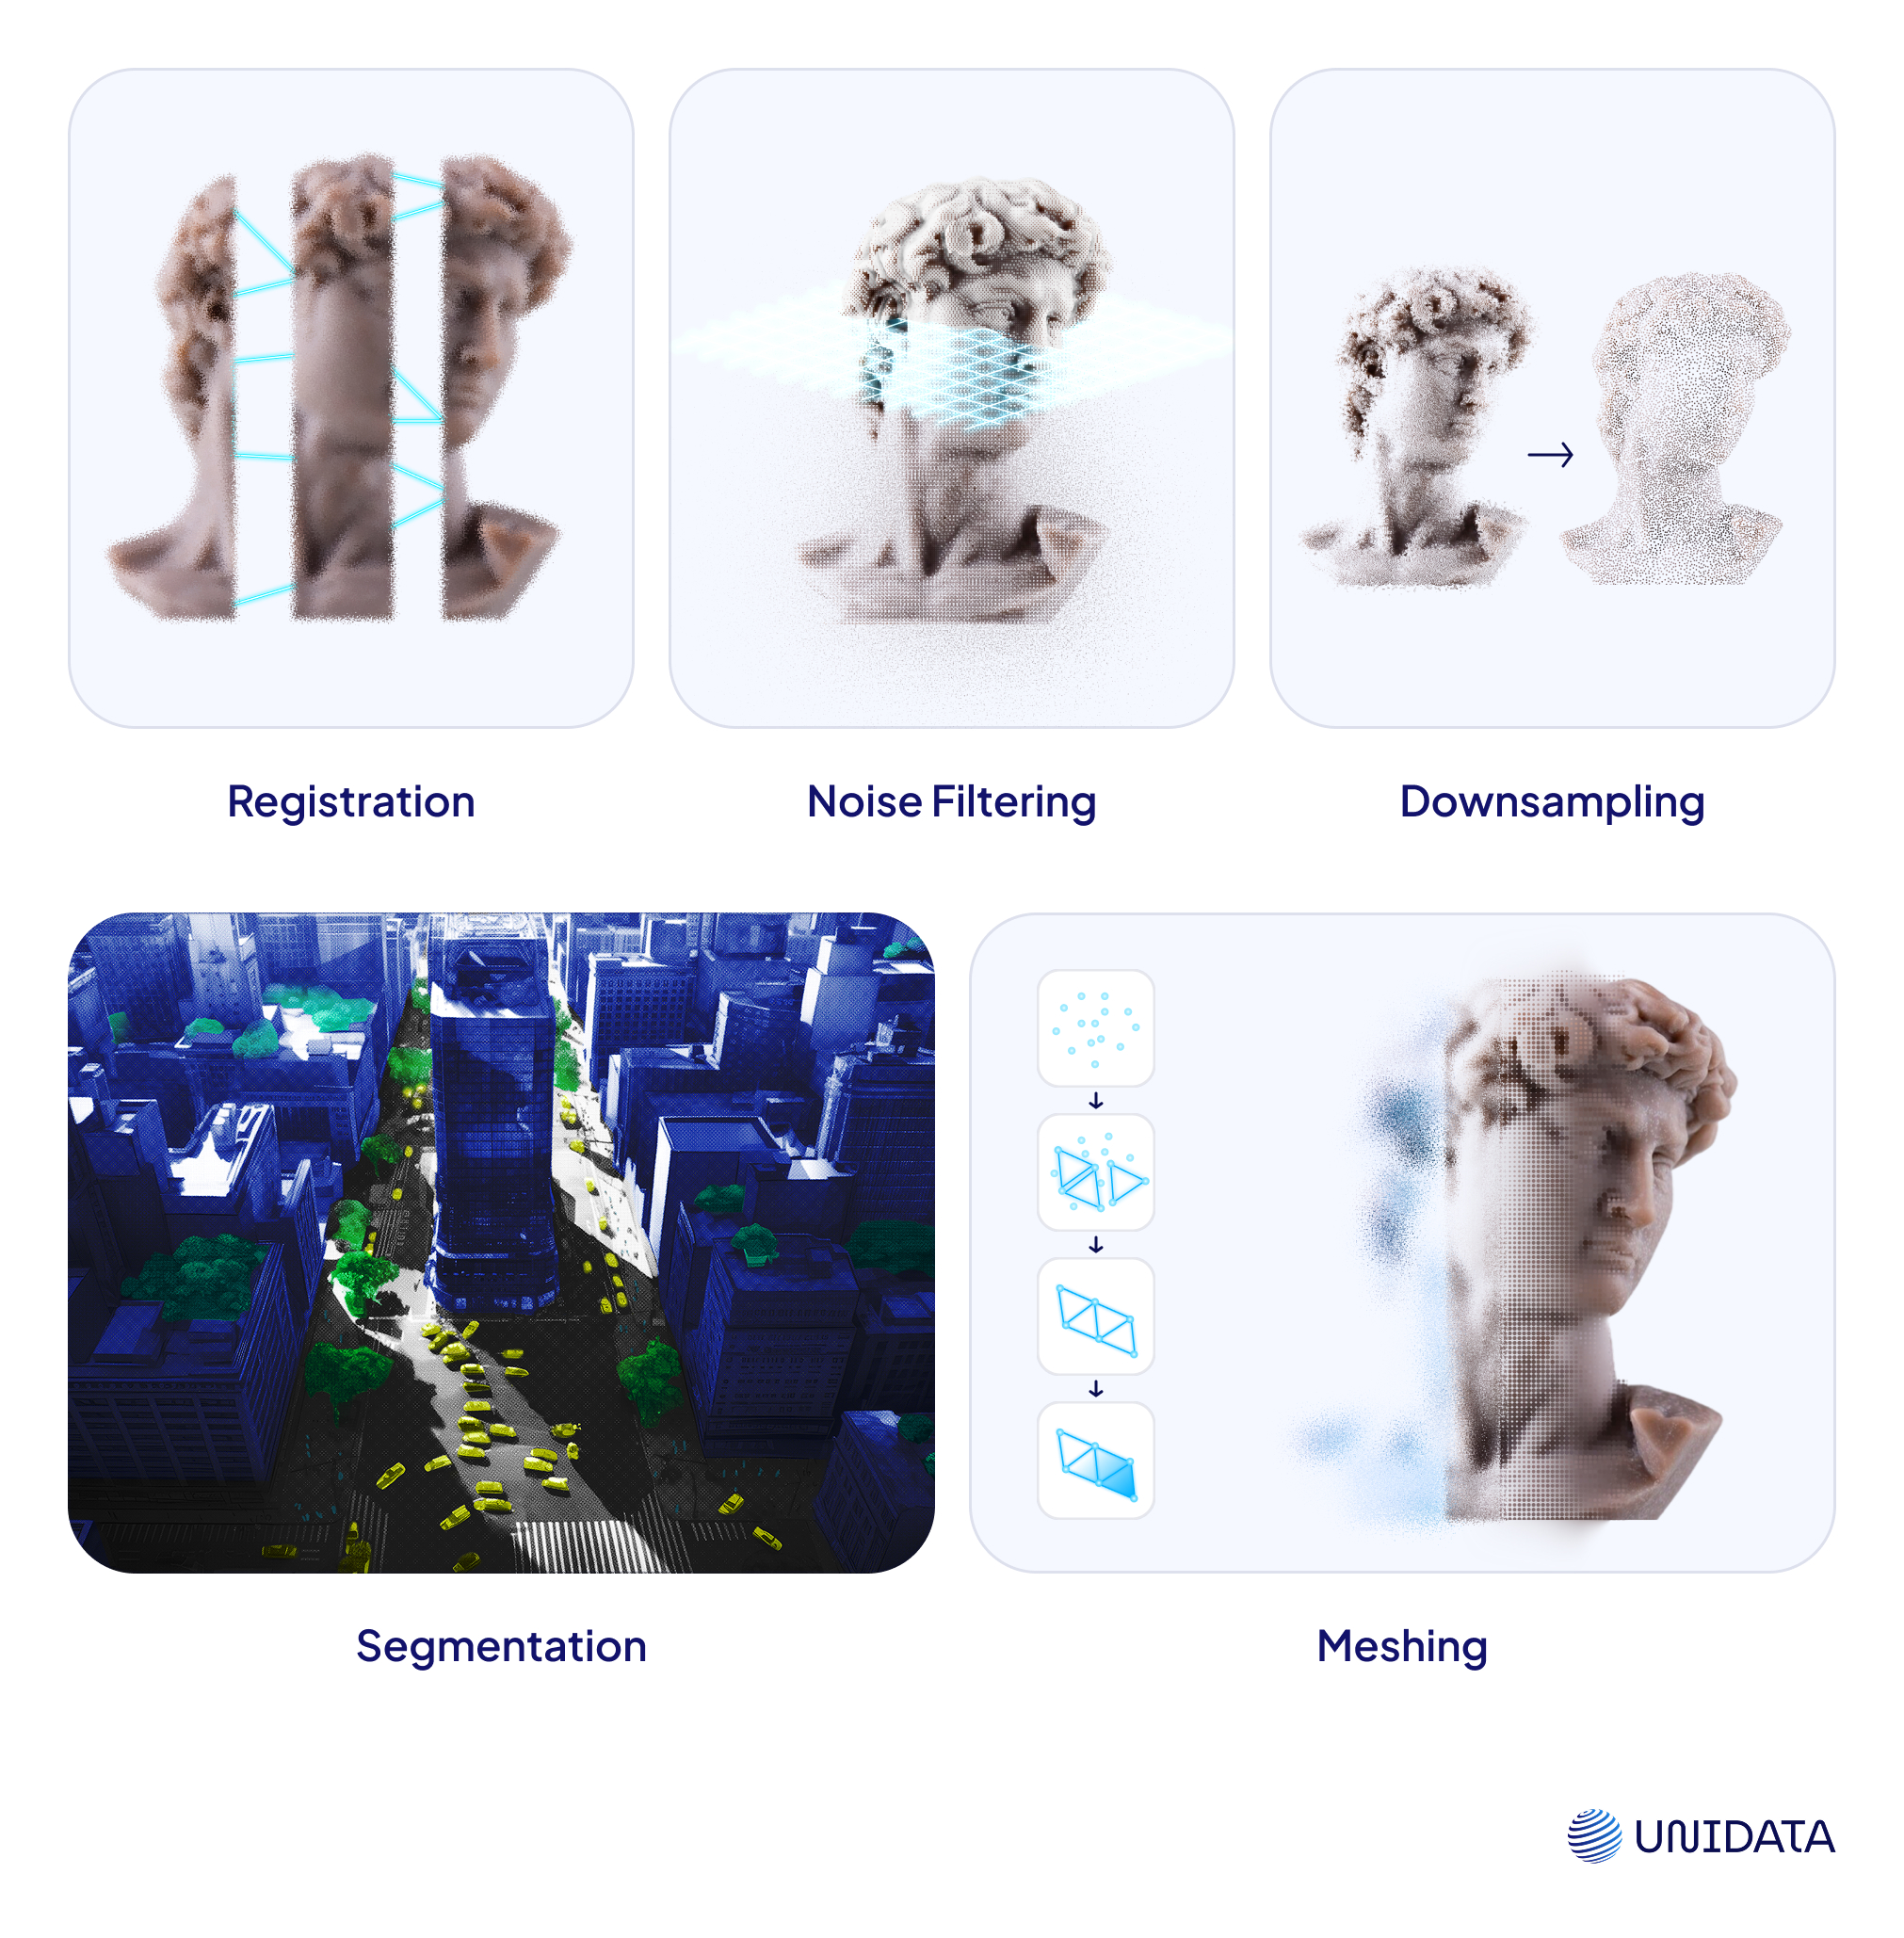
- Registration
When you scan something from different angles (which you almost always do), each scan is like a separate puzzle piece. Registration aligns all these pieces into one big picture. Think of it like stitching together photos into a panorama — except it’s in 3D. - Noise Filtering
Point clouds are messy. You’ll find random floating points from dust, movement, or sensor errors. Filtering helps you remove that junk. Cleaner data = better results later. - Downsampling
Raw point clouds can be massive — millions, sometimes even billions of points. To make them more manageable, we apply downsampling: a smart way of reducing the number of points without throwing away critical detail. Why do it? Because smaller clouds are easier to store, faster to process, and lighter to send. You get all the essential geometry — just without the digital bloat. - Segmentation
Once your point cloud is clean and organized, you can start breaking it into pieces. Segmentation is how you split the data into different parts — like separating a street from the buildings, or a car from the road. - Meshing (Optional)
Sometimes you want more than just points — you want solid surfaces. Meshing connects nearby points into triangles, creating a full 3D surface that can be rendered or 3D printed. This is optional, but often necessary for simulations and visual design.
What File Format Should You Use?
Different industries use different formats, depending on their tools and goals. Here are the most common ones you’ll run into:
LAS
This is our primary format. LAS is the standard for storing raw LiDAR data in uncompressed form. It packs in rich metadata — GPS timestamps, signal intensity, elevation, classification, and more.
It is perfect for large-scale environments like aerial surveys, mapping projects, forest monitoring, and construction site tracking.
LAZ
LAZ is the compressed counterpart to LAS. Ideal for smaller-scale scenes where file size matters — rooms, single objects, interior scans. We use it for lightweight 3D projects and easy file sharing across networks.
PLY
Originally developed for 3D scanning research, PLY supports both point clouds and polygon meshes. It’s popular in graphics, gaming, and research because it’s simple and flexible.
Check out the PLY format.
E57
This one’s built for interoperability. It’s great when you’re working with data from different scanner brands or types. It stores color, intensity, and even sensor calibration data.
Explore the E57 format
There are others — like OBJ and STL for meshes — but for raw 3D point cloud data, LAS, PLY, and E57 are your top contenders.
Point Cloud Annotation Workflows
Once you’ve got a clean point cloud, it’s time to give it meaning. That’s where annotation comes in. You're not just drawing boxes or labels — you’re teaching the system what to pay attention to. You’re turning raw geometry into training data that can power real-world AI.
But here's the thing: real annotation work rarely follows a neat, one-size-fits-all recipe. In theory, the process looks like this:
Load point cloud → Annotate → Export → Done.
In reality? It’s a bit messier. First, you get raw scans that do not align. Then comes the heavy occlusion. And before you know it, the auto-labeler mistakes a pedestrian for a lamppost.
That is where we come in. We do more than just annotate — we take ownership of everything that gets in the way of a smooth pipeline. Auto-tagging errors, tool glitches, unstable data — we handle it all, so your tech team does not have to.
The Tools You’ll Probably Use
Different teams have different preferences, but these three tools come up a lot:

- CVAT – Free, open-source, and highly customizable. Great for 2D and 3D, but it can get tricky with larger scenes.

- Supervisely — More user-friendly and team-oriented. It supports both point clouds and mesh overlays and has solid automation support.

- Labelbox — Slick interface, strong enterprise support. Best if you're working on a mix of 3D, video, and image annotations.
Some teams also build their own internal annotation tools, especially if their use case is highly specialized or if they want better control over automation features.
What Actually Happens During Annotation (Theory vs. Reality)
If you read an academic paper on 3D point cloud annotation, you’ll find a clean, four-part pipeline that looks something like this:
- Data Preprocessing
- Annotation (Manual or Assisted)
- Review & Validation
- Dataset Packaging for Training
On paper, it’s neat. Efficient. Predictable.
But when your team starts labeling a LiDAR scan of a construction site during a rainy day, theory starts falling apart. Let's break both versions down side by side to show where they align — and where reality hits differently.
1. Preprocessing
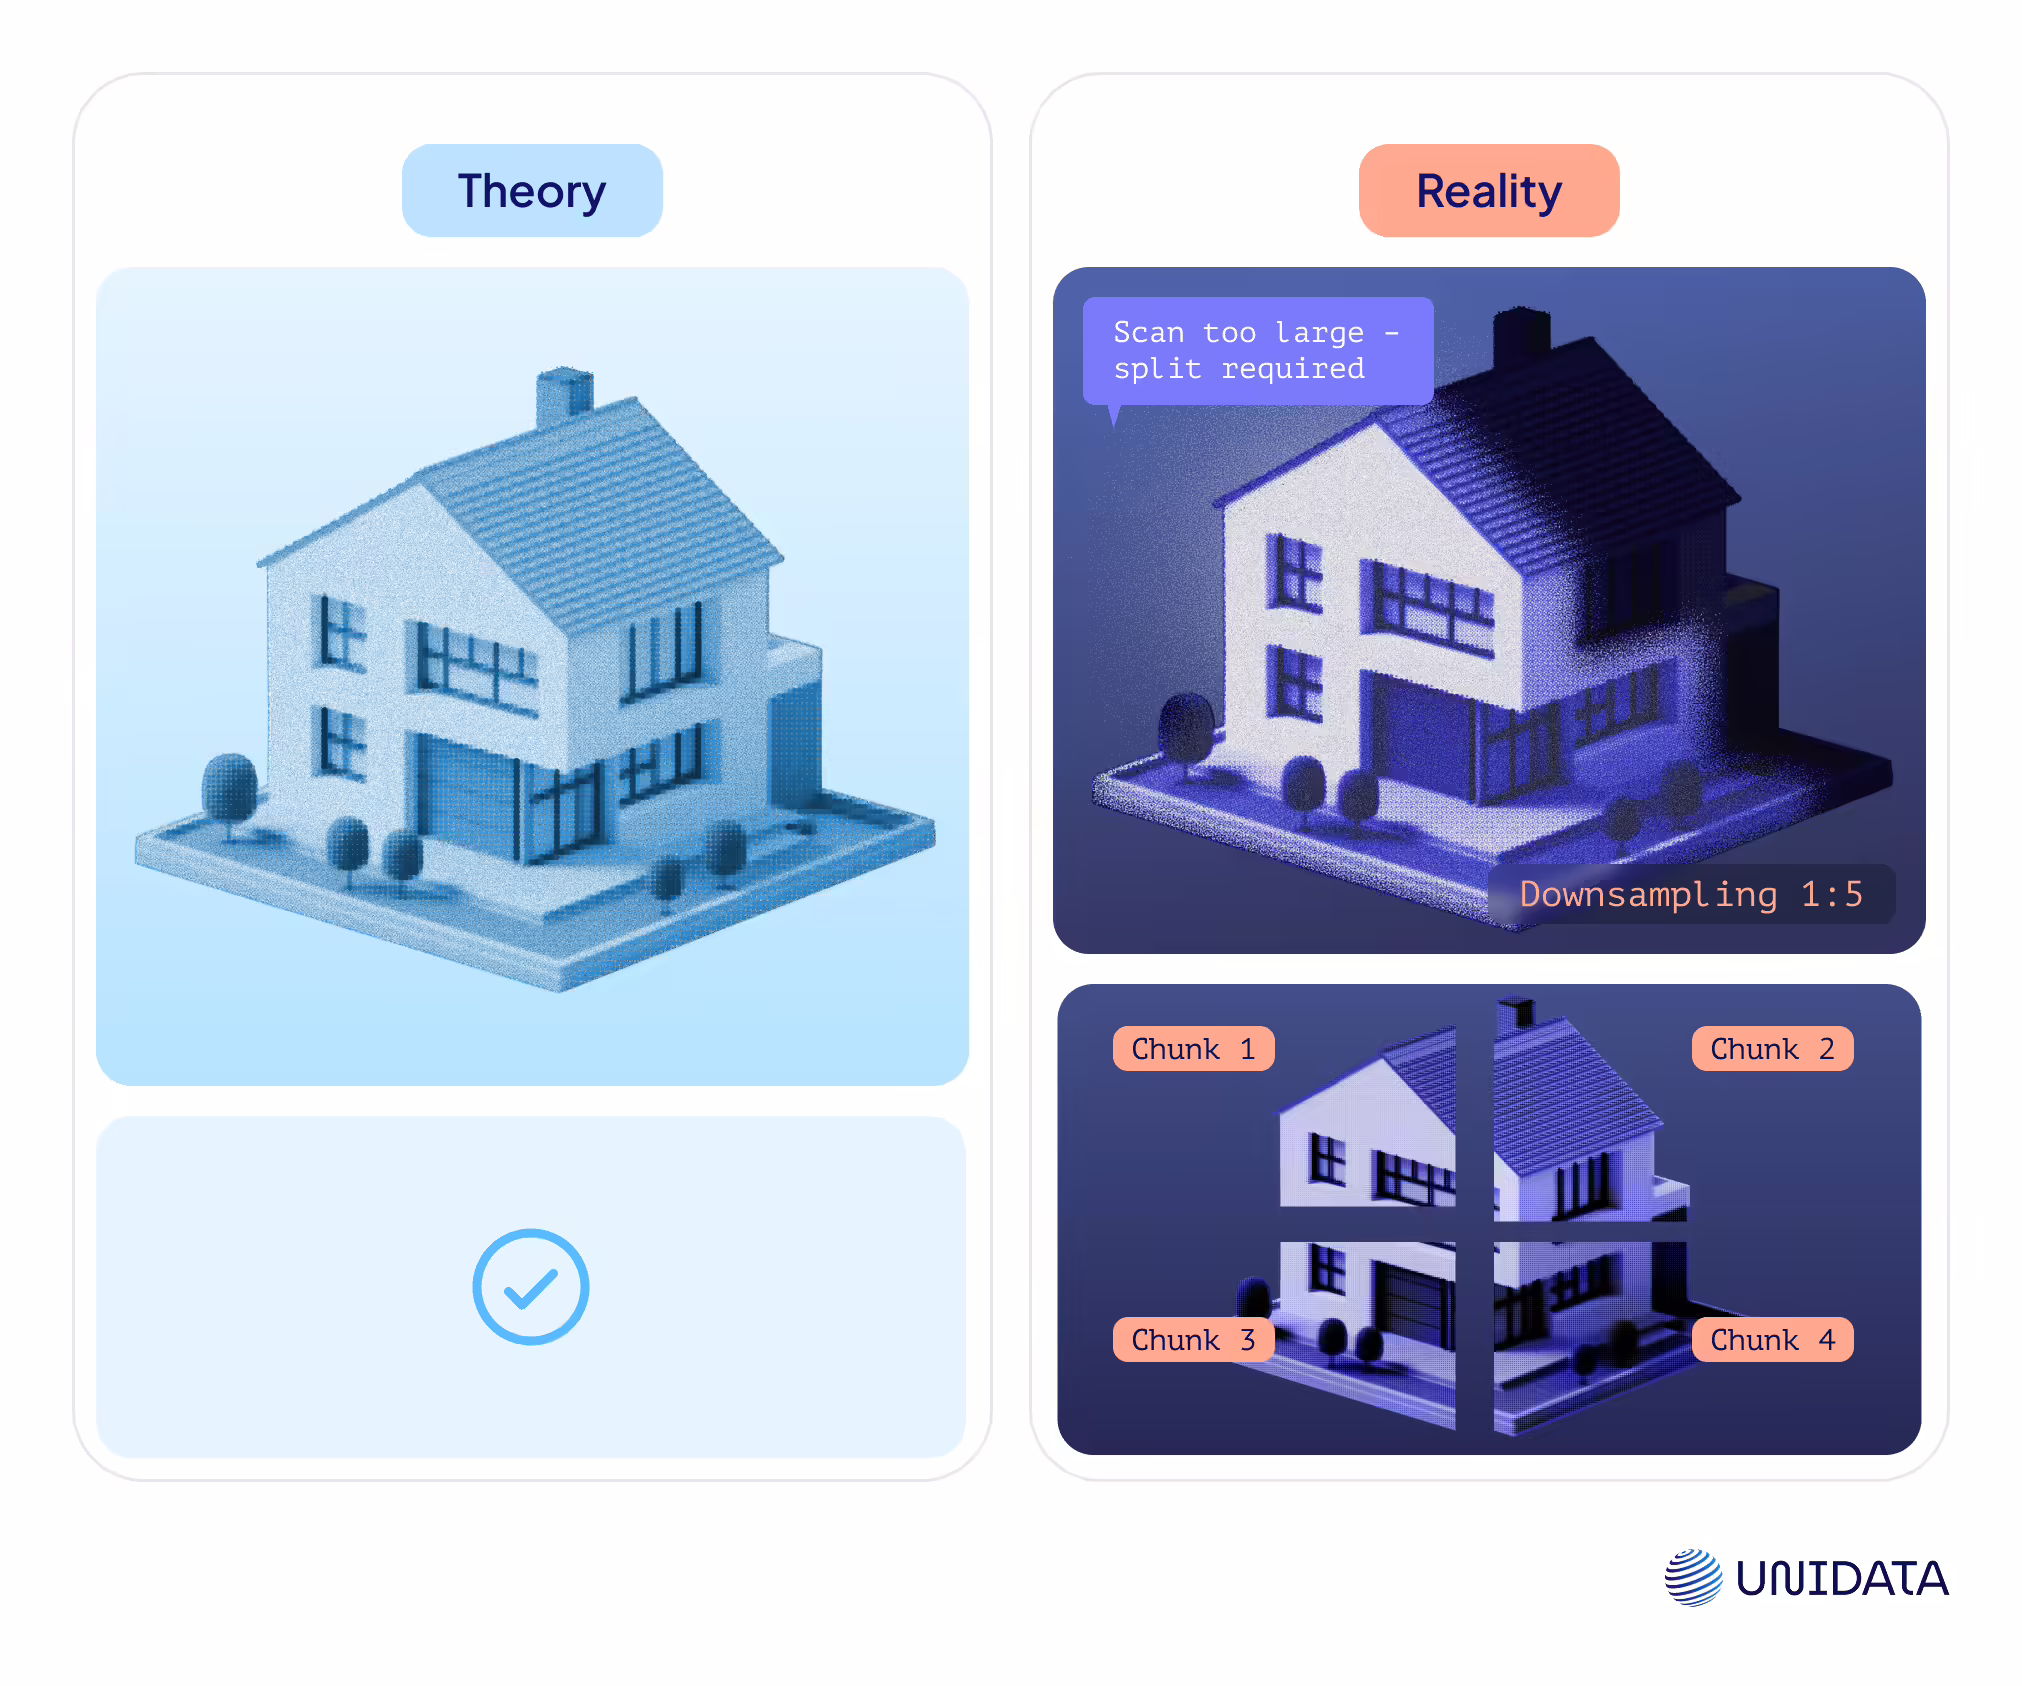
In an ideal setup, preprocessing ensures the raw point cloud is structured and aligned. This involves:
- Registration of multiple scans into a single coordinate space.
- Noise removal to filter out irrelevant points or artifacts.
- Downsampling if the point density is too high to manage efficiently.
- Cropping or ROI selection to isolate the relevant area for annotation.
In theory, this step is fast and mostly automated using built-in scanner software or scripts.
In practice?
It’s one of the most unpredictable steps. Registration can be misaligned. Some sensors capture noise or motion blur. Scans may be too big for the annotation tool to load.
We break large scenes into smaller, manageable chunks.
Then we reduce the point count, using the same logic as in video annotation: instead of labeling all 60 frames per second, you keep 1 to 5. It works the same with Lidar — downsampling makes it possible to annotate even in tools like CVAT without crashing the system.
These are the kinds of smart optimizations that turn a project from overwhelming to fully workable.
2. Annotation
This is where actual labels are created. There are different approaches here:
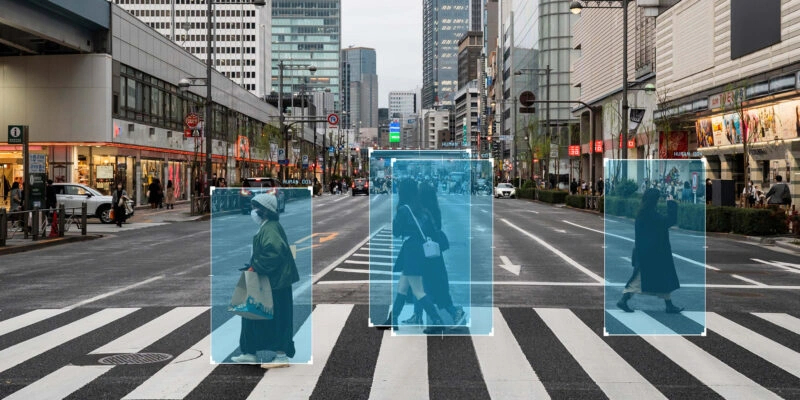
- 3D Bounding Boxes: Common in AV datasets — labeling vehicles, pedestrians, street signs.
- Semantic Segmentation: Assigning a class to every point (e.g., road, tree, building).
- Instance Segmentation: Like semantic segmentation, but distinguishing between instances of the same object (e.g., multiple cars).
- Polyline or Keypoint Annotation: Used for infrastructure or articulated object parts.
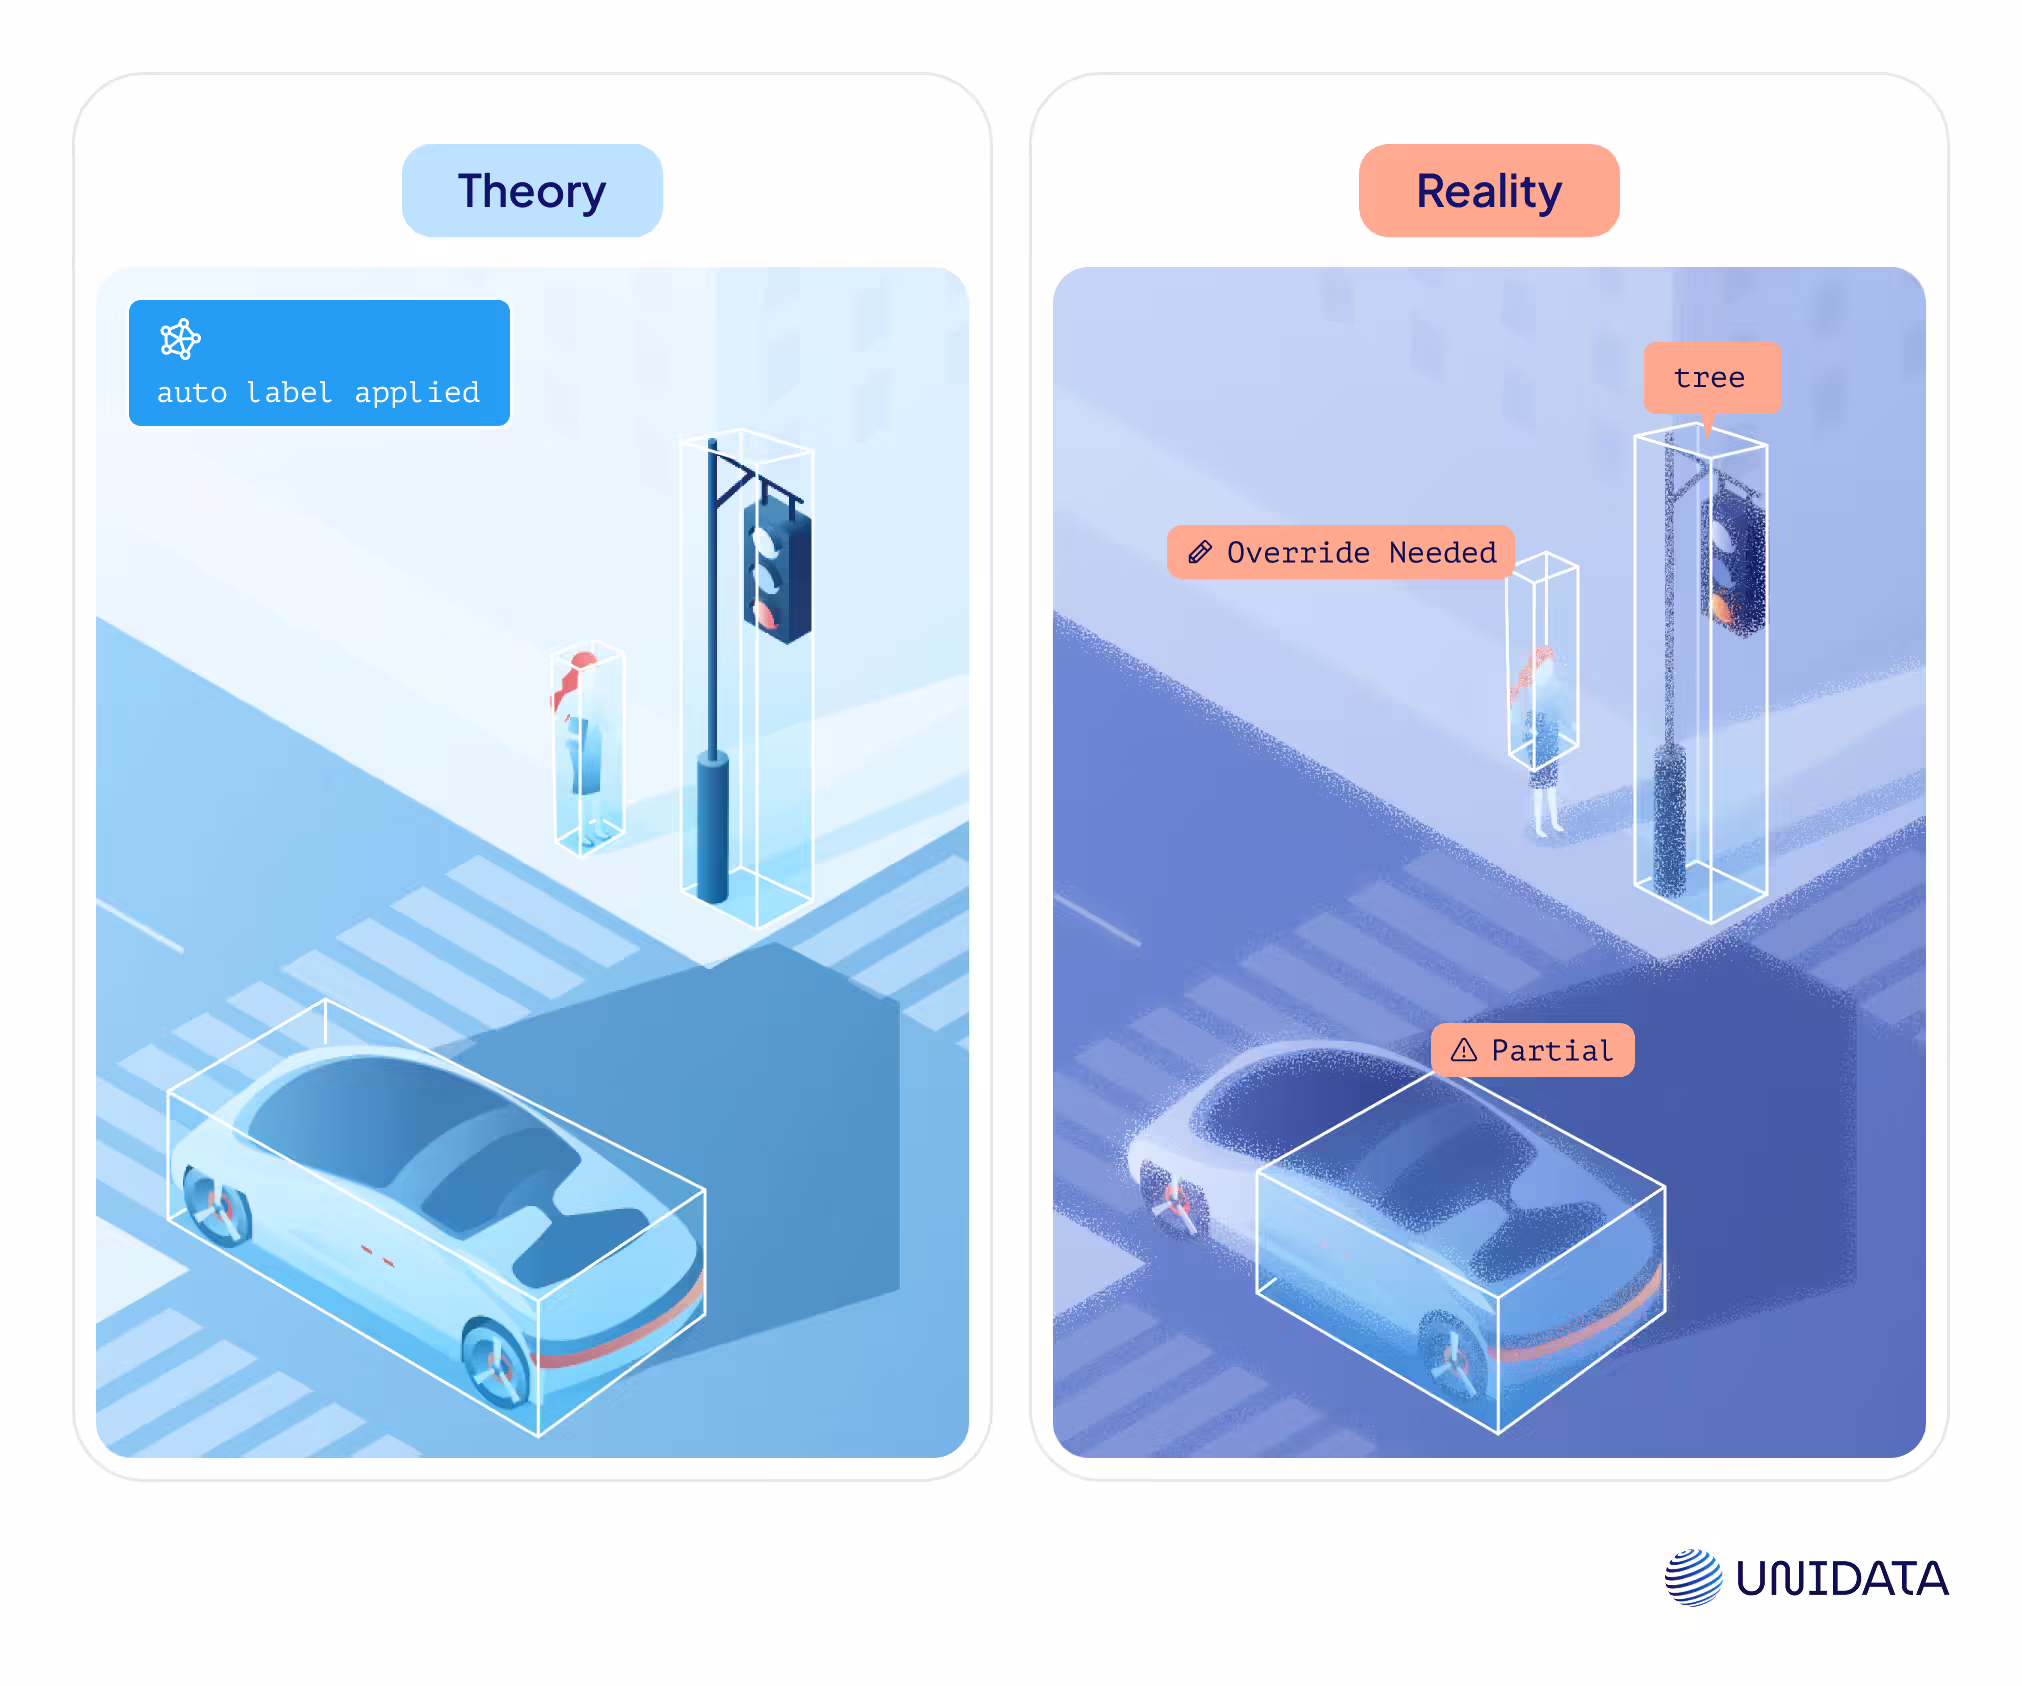
Most academic setups assume partial automation. That includes:
- Pre-annotated objects based on model predictions.
- Assisted labeling using point clustering or plane fitting.
In reality: Auto-labeling helps — but it rarely finishes the job. Occlusions, overlapping objects, or sparse scans require manual tweaking. And in complex scenes, like highway intersections or construction zones, automation can misclassify an entire region. That’s why human annotation is crucial.
How we handle it: We use 3D cuboids — an efficient, adaptable way to label objects in point clouds.
When it comes to tricky structures like curbs, we rely on time-tested hacks: we create a single averaged segment and duplicate it with slight rotations along the curb’s path.If the curb is straight, one long cuboid might be enough — as long as every point actually falls inside. That part is critical.
For dynamic or curved shapes — like winding roads, bollards, or bends — we place a series of smaller, slightly tilted cuboids. This creates a smooth, rounded effect without sacrificing precision.
3. Review & Quality Check (Academic View)
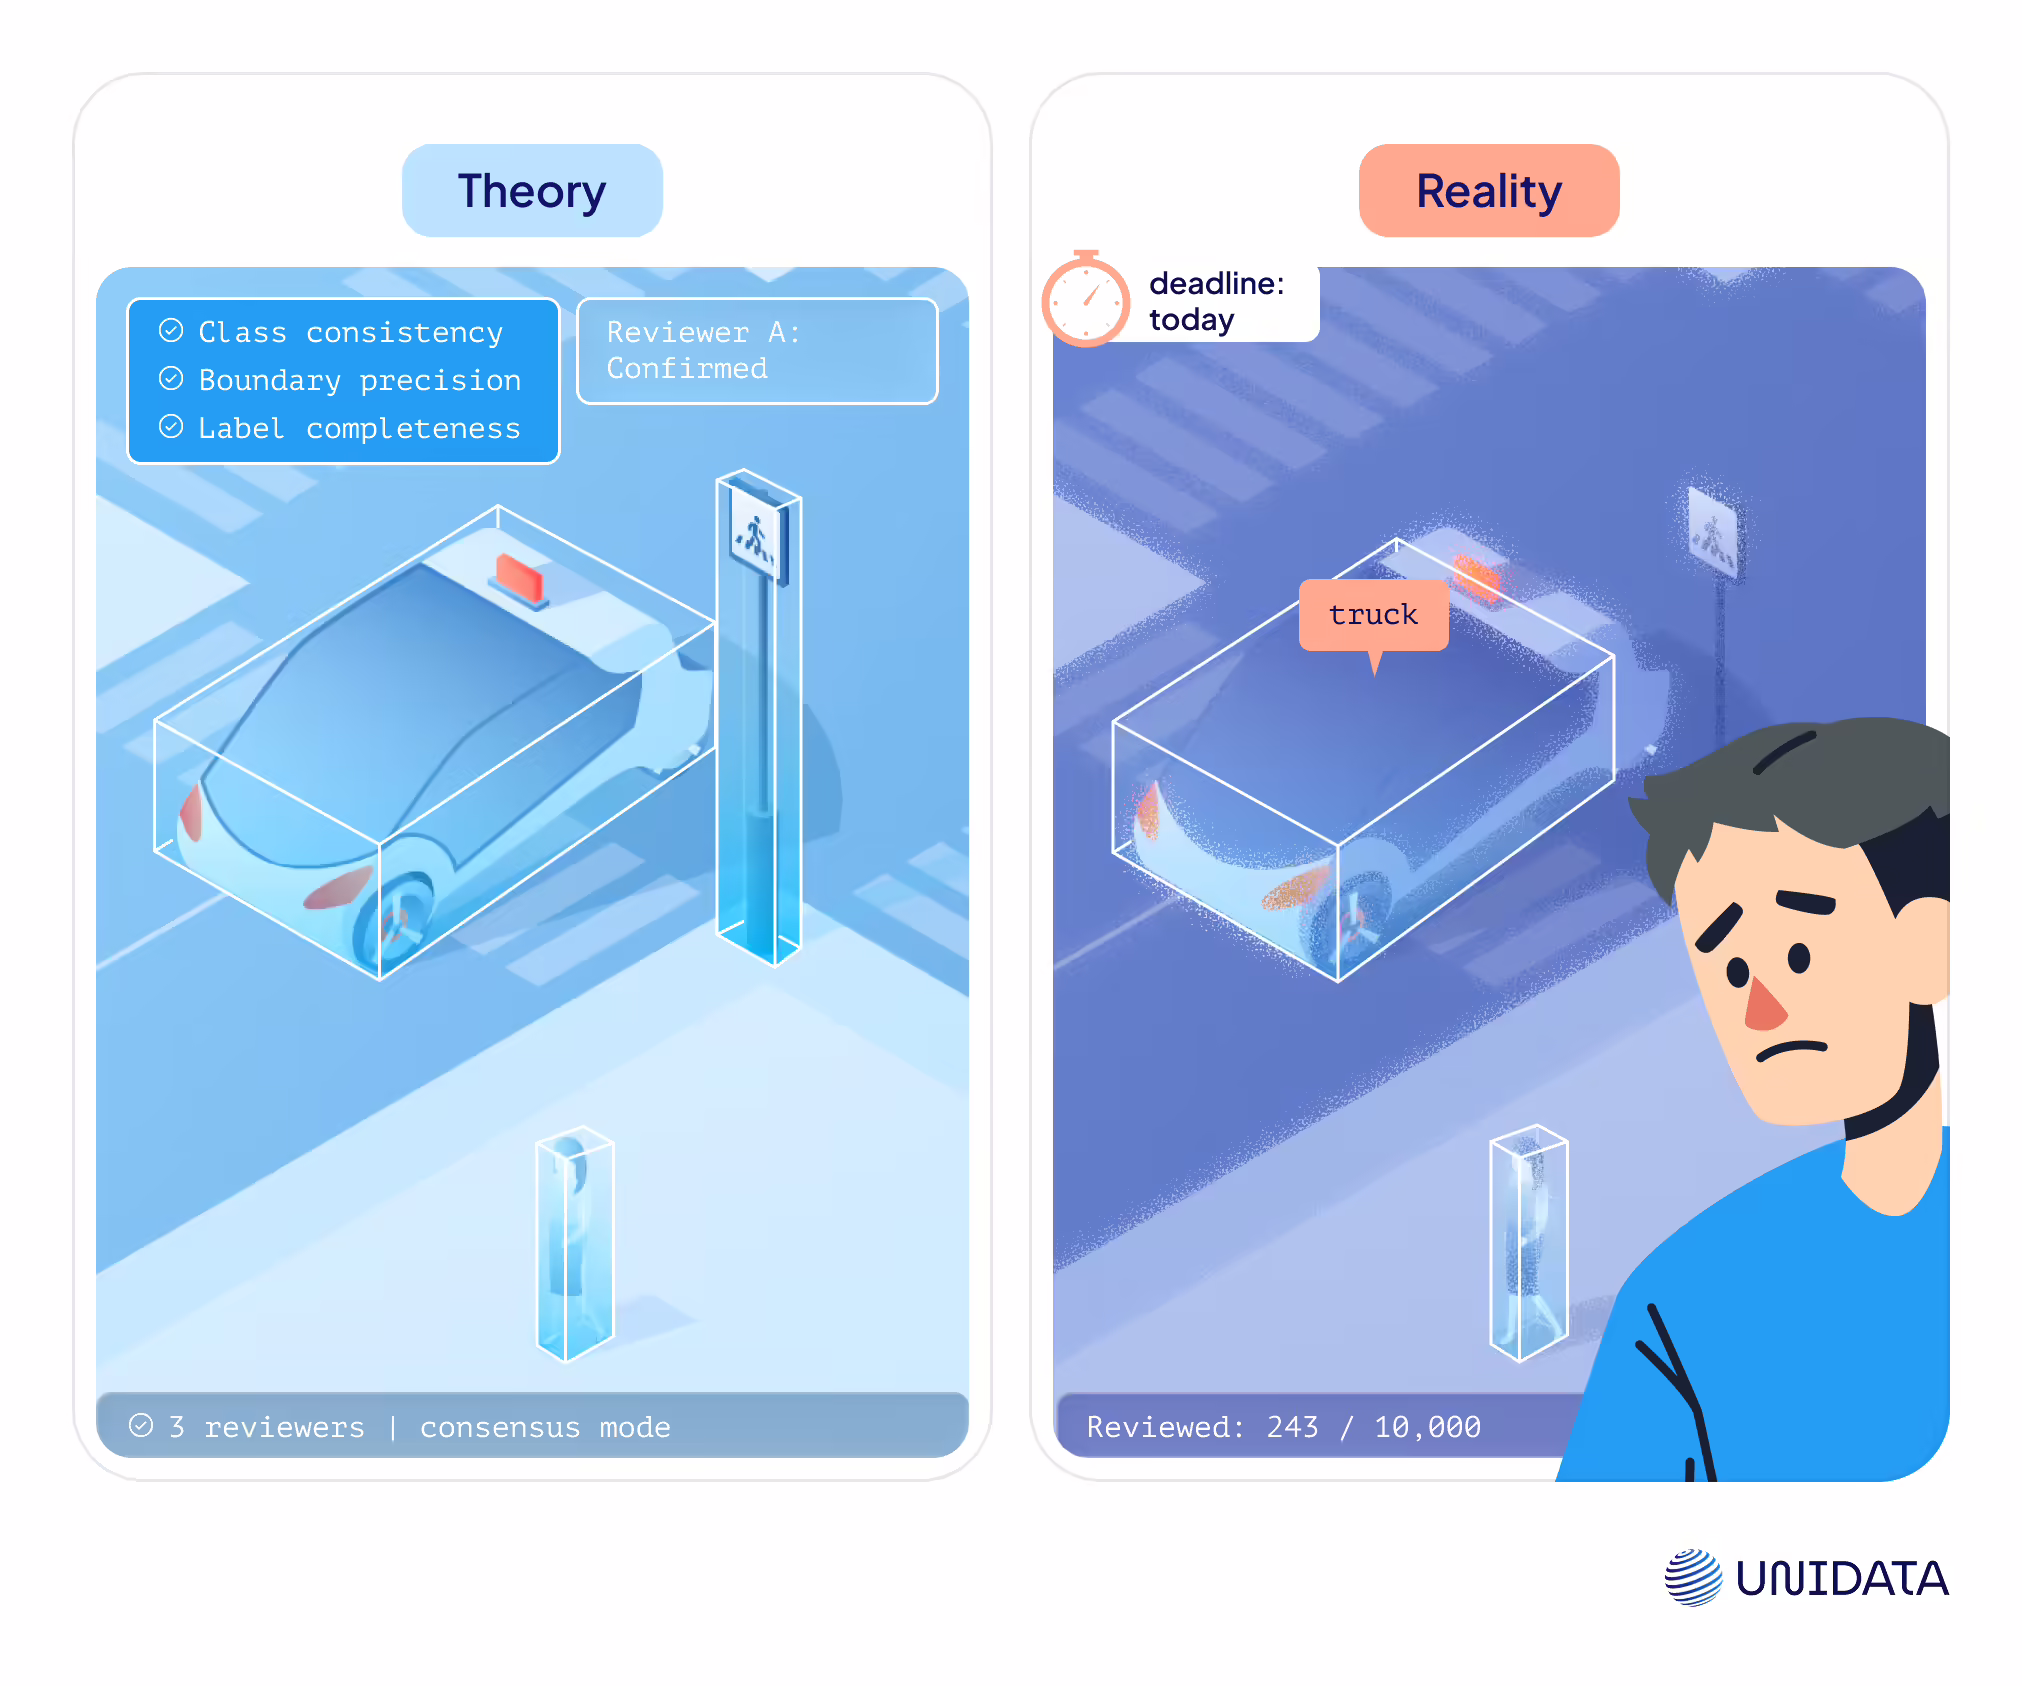
This step is designed to catch errors. Reviewers check for:
- Class consistency: Are “bicycles” labeled as “motorbikes” anywhere?
- Boundary precision: Are objects tightly fit?
- Label completeness: Did anyone skip an object?
Reviews are often guided by internal QA standards and annotation guidelines. Some setups include multiple reviewer consensus to reduce subjectivity.
In reality: Review steps often get rushed — or skipped — when deadlines get tight. One reviewer can’t keep up with 10K+ frames. Feedback gets lost. Errors slip through and impact model performance down the line.
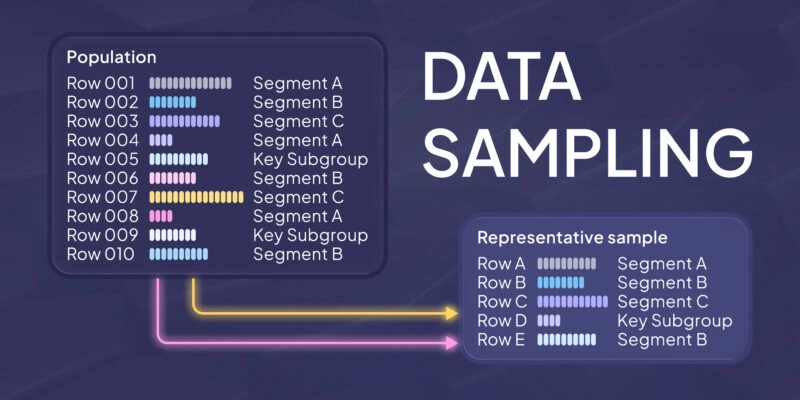
What we’ve built for QA: To ensure labeling quality, we use a targeted 99/2 QA strategy: we manually review a small but representative sample — just 2% of the scenes, carefully selected to reflect the full dataset.
In 3D, overlap between annotators is costly, so we avoid redundant work. Instead of double-labeling, we run pinpoint reviews to catch and fix systematic issues before they ever reach production.
4. Feedback Loops: The Invisible Step That Matters Most
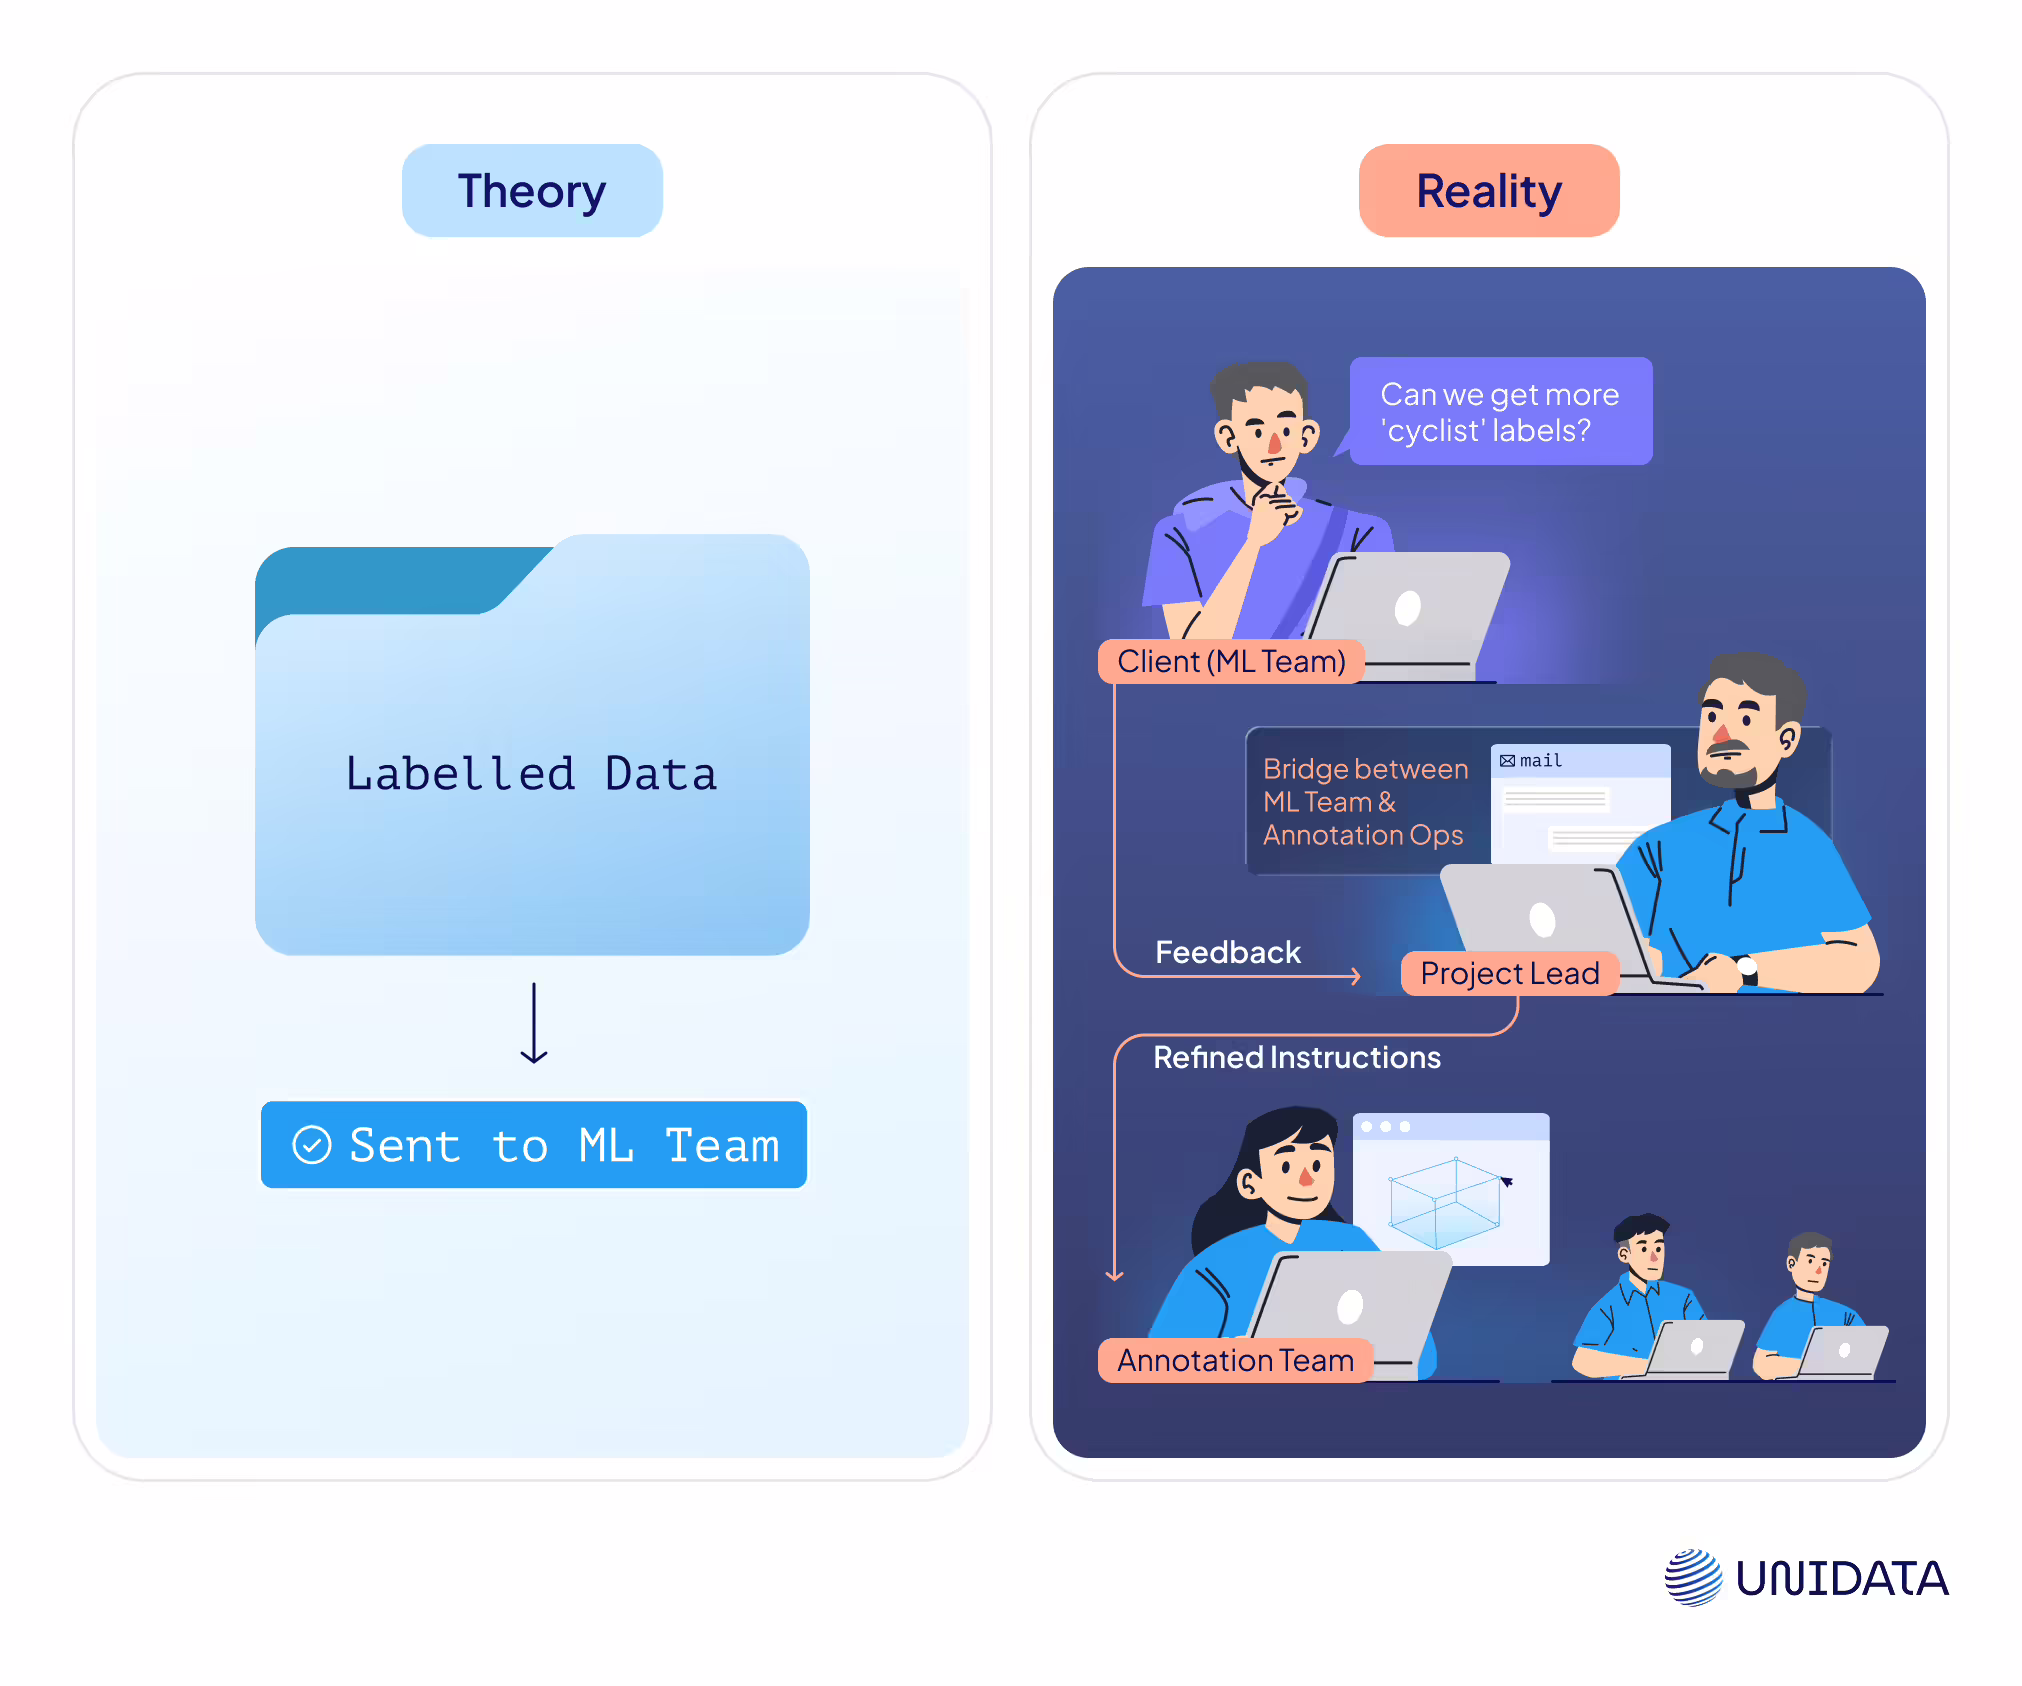
The theory: Once the labels are approved, they’re shipped off to training teams and everyone moves on.
In reality: You always get feedback. “This class needs more examples.” “The segmentation wasn’t tight enough.” And sometimes, the label definitions change mid-project.
How we adapt fast:
For every client, we assign a dedicated project lead — a person who:
- owns the class structure and keeps it consistent
- manages escalation of edge cases
- acts as the bridge between annotators and ML engineers
But their role goes beyond operations. They bring domain expertise to the table. Since we have tackled similar tasks many times before, we help clients dive deeper into the subtleties that directly affect model accuracy.
This role is critical. Thanks to it, we cut down iteration cycles and stay focused even when project requirements shift midstream.
Key QA Methods That Actually Work
Spot-checks
We review 5–10% of files in every batch, checking for accuracy, completeness, and correct point placement. But it’s not just a blind percentage — it’s a targeted system.
Here’s how it works: if a particular annotator consistently delivers error-free results, our validator shifts attention to annotators with higher error rates. It’s a dynamic approach that prioritizes risk.
Sometimes, full-scale validation is not even needed — especially when we start with proven high-performers and proper hardware setups. In this model, quality control (QC) sits with the Project Lead, ensuring efficiency without compromise.
Cross-validation
Assign the same file to two annotators. Compare results. Misalignment = unclear instructions or a complex edge case.
Tool-based metrics
We use built-in analytics to track annotation time, overlaps, and drift. These signals help us quickly spot suspicious segments — long before they cause trouble downstream.In tools like CVAT, this becomes even more powerful: we can open the Issues tab, jump straight to the relevant job, and see exactly where something went wrong. Annotators and validators leave comments directly in the scene, flagging mislabels or inconsistencies.
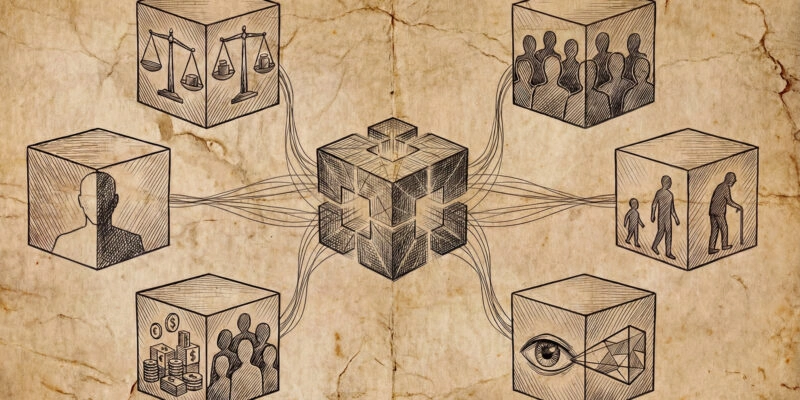
Applications & Business Use Cases
3D point clouds aren’t just academic data — they power real systems, solve real problems, and unlock automation in places where 2D simply doesn’t cut it.
From highways to heritage sites, here’s where this tech is already delivering serious results.
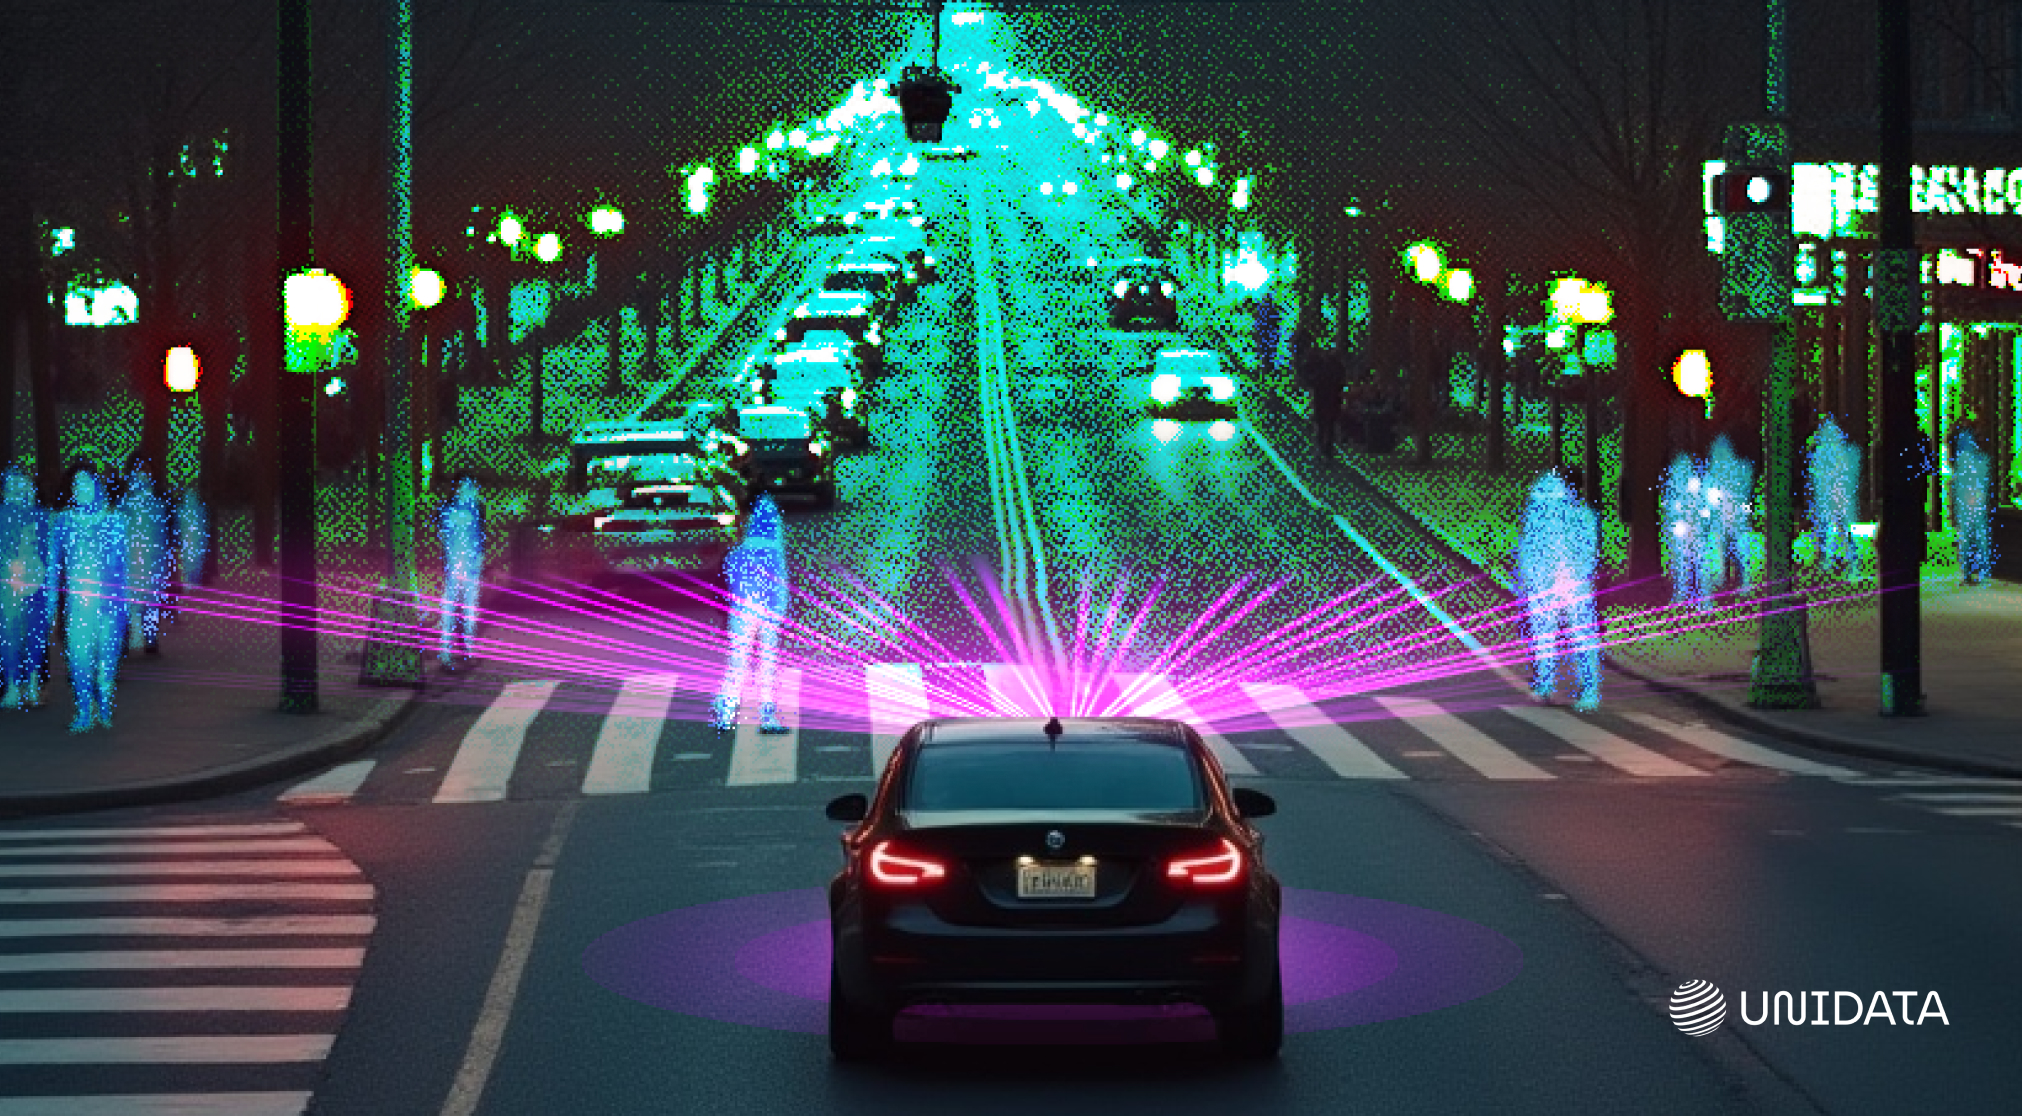
Autonomous Vehicles
LiDAR point clouds are the foundation of AV perception stacks. Vehicles rely on them to detect road users, obstacles, and infrastructure in real time — regardless of lighting or weather.
Construction & Site Monitoring
Drone-based LiDAR or photogrammetry scans help track progress, spot deviations, and verify structural integrity week by week.
Cultural Heritage & Digital Archiving
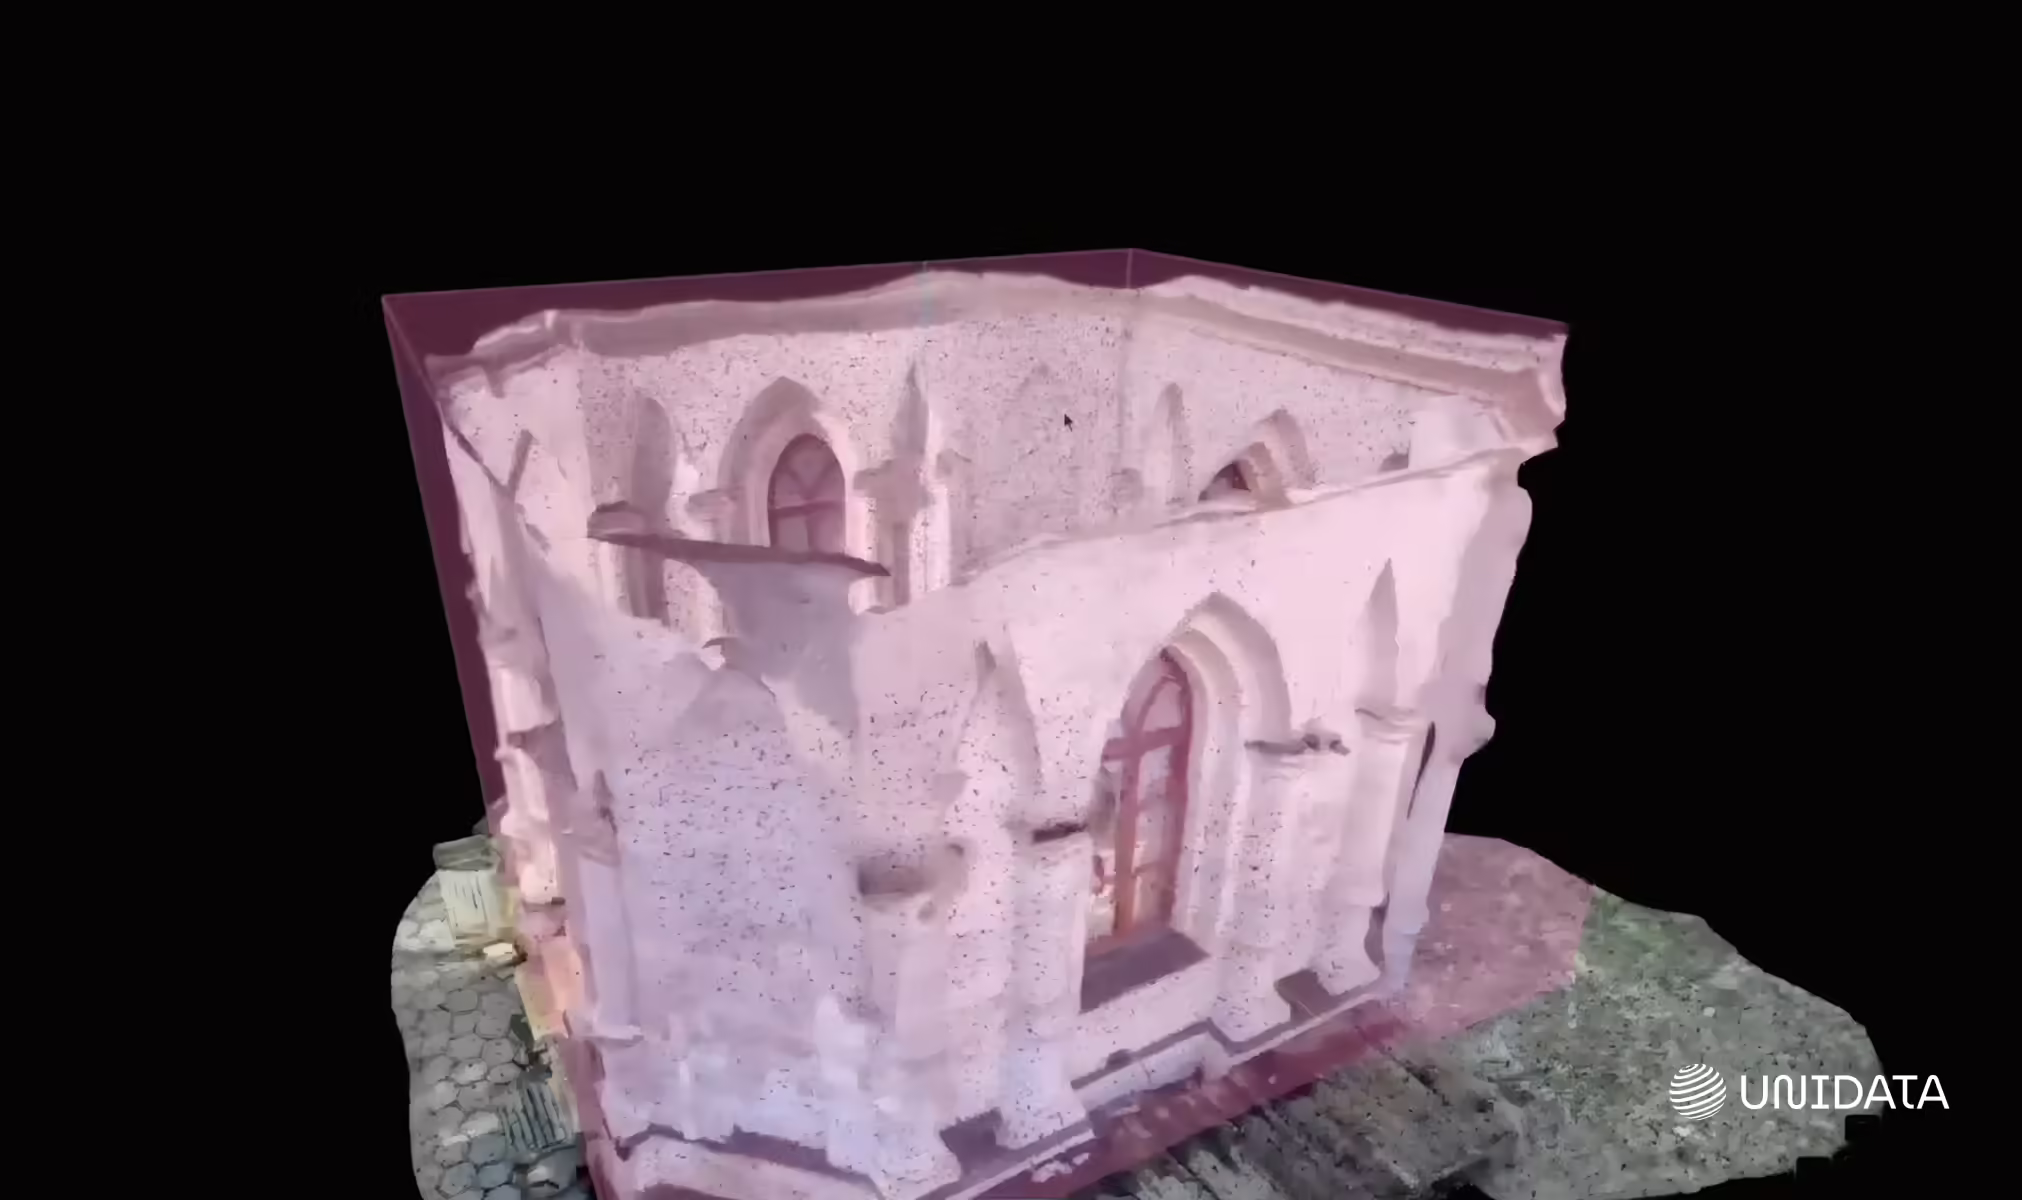
Point clouds allow ultra-precise scans of historical buildings, statues, and dig sites — without physical contact. These digital twins are used for conservation, virtual tourism, and 3D restoration.
Robotics & Warehouse Automation
Indoor point clouds captured via structured light or depth sensors allow robots to localize, avoid obstacles, and plan paths through cluttered environments.
Telecom & Infrastructure
Utilities use LiDAR to scan towers, power lines, and pipelines. Annotated point clouds help detect damage, assess vegetation risk, and plan maintenance without sending teams on-site.
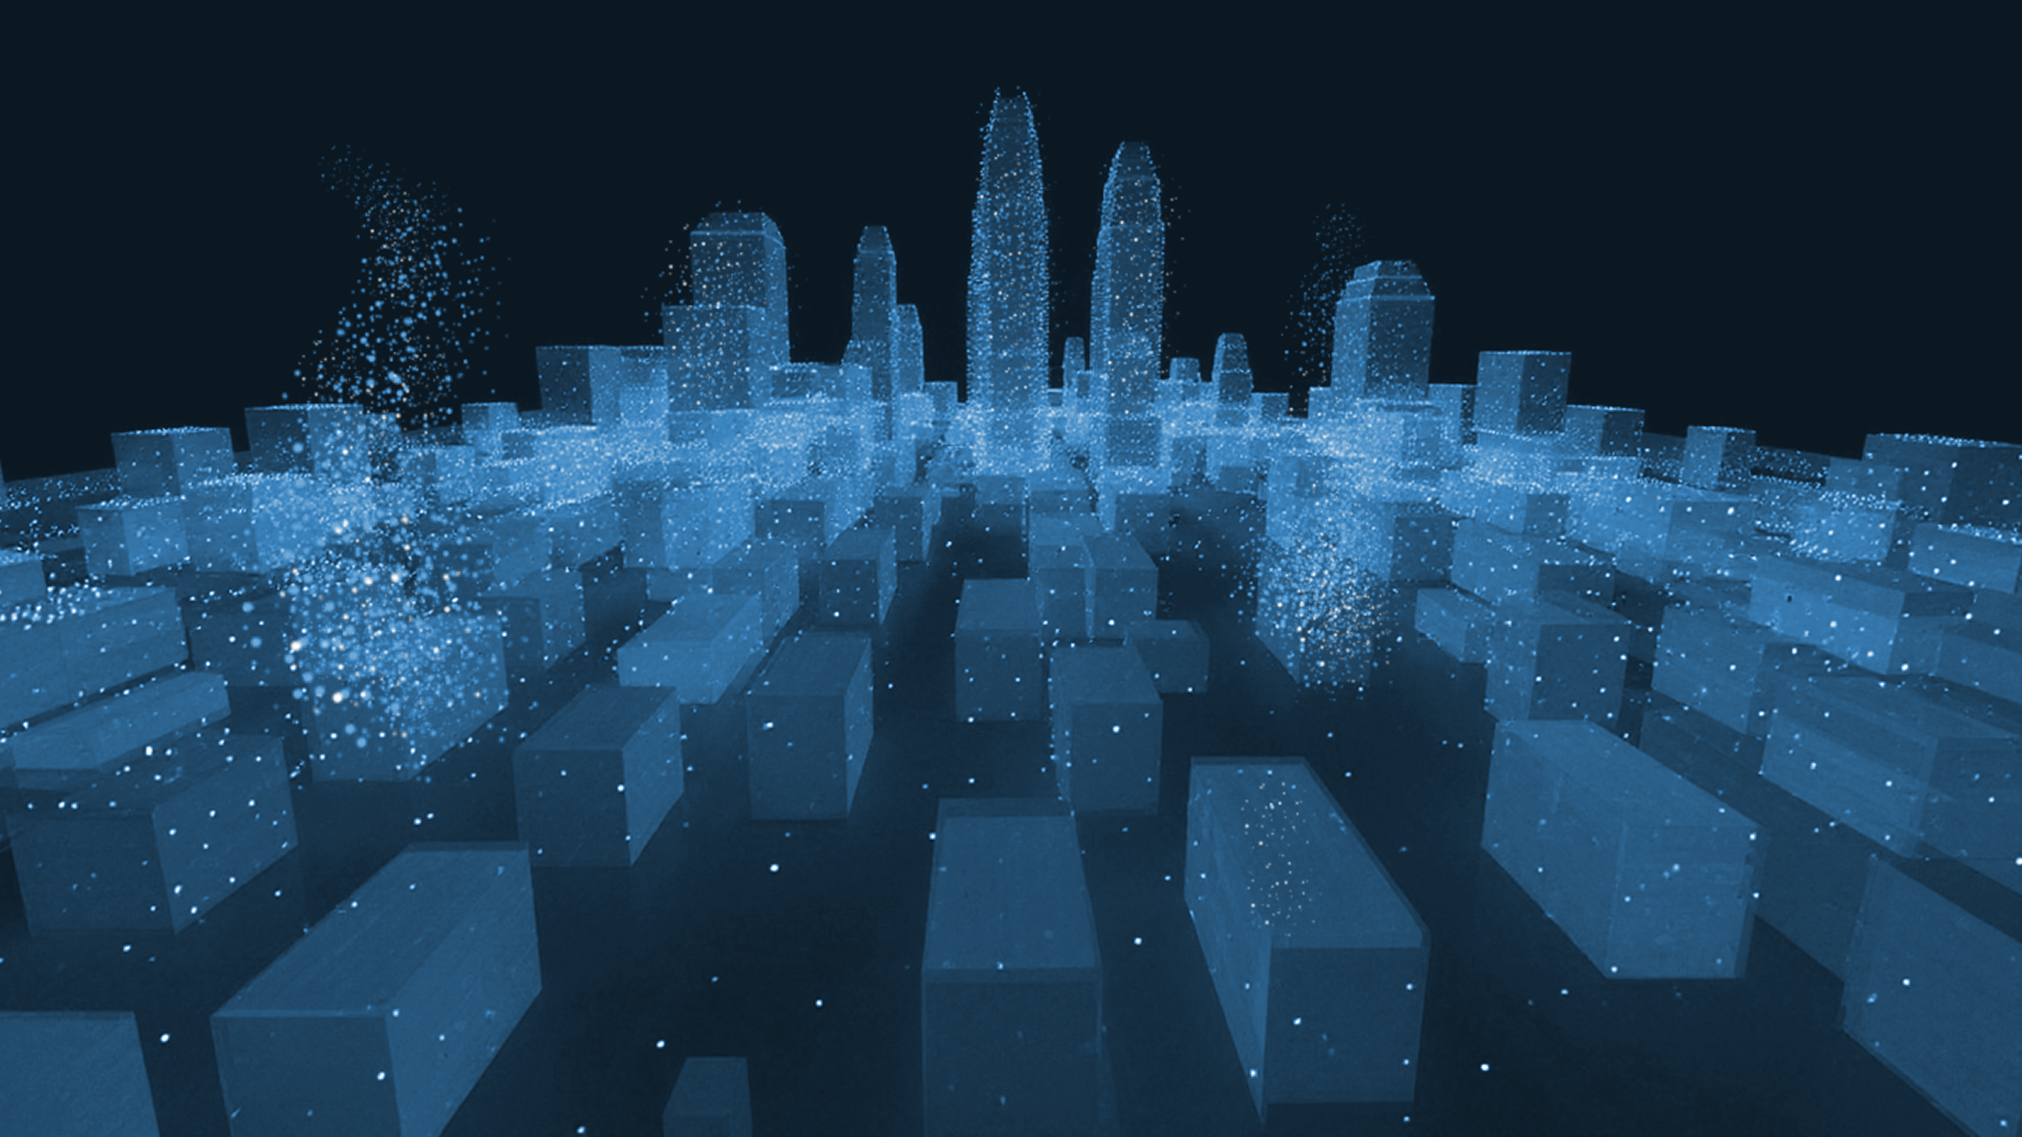
Smart Cities & Urban Planning
City planners use aerial and street-level scans to build 3D models of urban spaces. These models inform zoning decisions, simulate foot traffic, and plan infrastructure upgrades.
Final Takeaways
Point cloud annotation isn’t just a task — it’s the difference between a model that struggles and one that performs.
Done right, it speeds up training, boosts accuracy, and cuts down review cycles. But doing it right takes more than tools. It takes strategy, process, and a team that knows how to handle complexity without slowing you down.
That’s where we come in. We don’t just draw boxes — we build pipelines that scale, QA systems that catch errors early, and workflows that adapt when the data doesn’t play nice.
Clean, structured 3D data is the foundation. Let’s build it right — from the first point to the final deployment.
Frequently Asked Questions (FAQ)
A 3D point cloud is a set of data points in space, usually collected by LiDAR or other 3D scanners, that represent the shape and structure of real-world objects.
They’re created using LiDAR, photogrammetry, or structured light. Each method scans the environment and records millions of (X, Y, Z) coordinates.
LiDAR (Light Detection and Ranging) uses laser pulses to measure distances between the sensor and surrounding objects, producing a detailed 3D point cloud.
It’s the process of labeling points or regions in a cloud to train AI — often using 3D bounding boxes or segmentation for tasks like object detection.
LAS, LAZ, PLY, and E57 are the most widely used formats, depending on the application and level of detail required.